FIG 2.

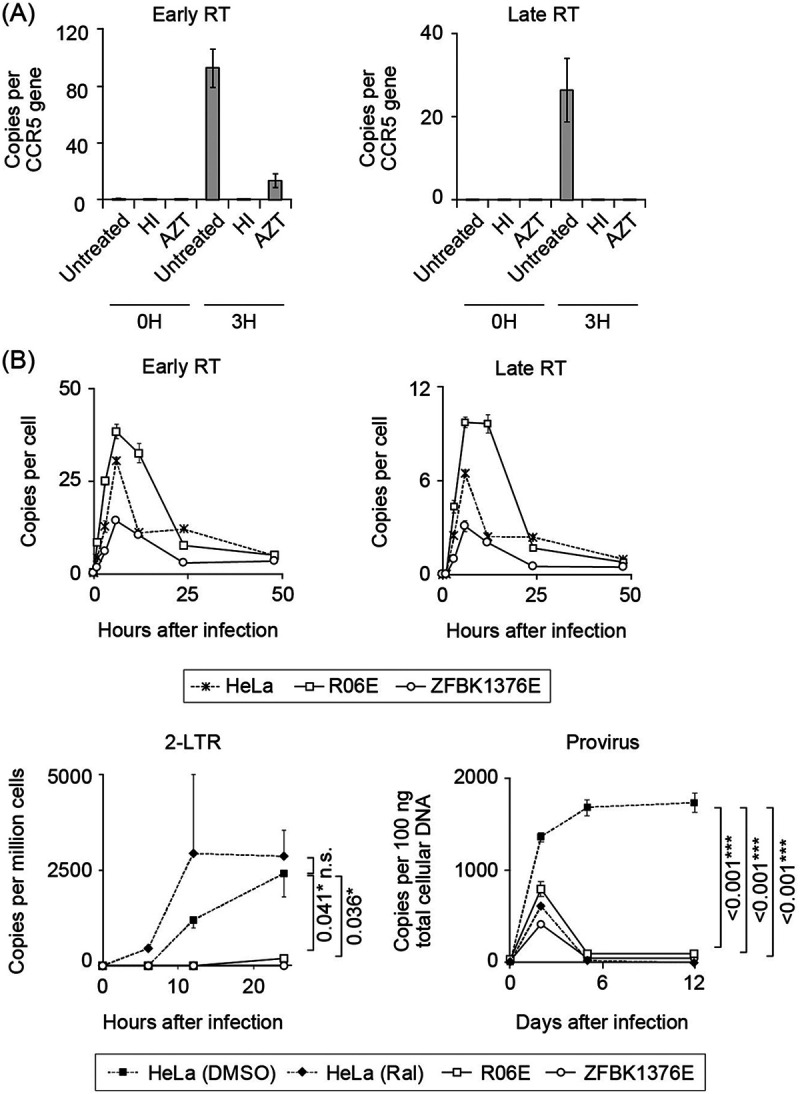
Quantitative PCR (qPCR) of viral reverse transcription (RT) products. The copy numbers of early/late RT products, 2-LTR circles, and proviruses in infected cells were determined by qPCR. (A) Verification of qPCR of viral RT products. Background yield of viral DNA in bat cells was measured by infecting megabat R06E cells with heat-inactivated HIV-1 or untreated HIV in the presence of an RT-blocking reagent, azidothymidine (AZT). Early (left panel) and late (right panel) RT product yields were quantified at 0 and 3 h after infection. Relative amounts of early and late RT products were significantly reduced by treatment of infected cells with AZT. (B) Quantification of HIV-1 early and late RT products, 2-LTR circles, and provirus in HIV-restricting megabat (R06E and ZFBK13-76E) or control (HeLa) cell lines. Cells were inoculated with a single-round replicating HIV-1 at a virus titer that resulted in approximately 10% GFP positivity in the control cells. This titer corresponds to an MOI of <1 (78). Early and late RT products were measured at 0, 1, 3, 6, 12, 24, and 48 h after infection. To detect 2-LTR circles and provirus, HeLa and megabat cells were treated in a similar manner as for the detection of early and late RT products, but with or without raltegravir in control HeLa cells. 2-LTR circles were measured at 0, 6, 12, and 24 h after infection. To detect provirus, infected cells were passaged twice weekly for 12 days, and provirus was measured at 0, 2, 5, and 12 days after infection. qPCR was performed in triplicate, and error bars in each panel represent SD of the triplicate data. Representative results from at least three independent experiments are shown. In the lower panels, statistical significance was assessed with analysis of variance (ANOVA; P < 0.05 was considered significant), and Dunnett’s post hoc comparisons between the control and bat groups were performed for the data obtained from the cells with the highest viral inoculum: P values of <0.05 (*), <0.01 (**), and <0.001 (***) were considered significant. Statistical significance was not assessed by ANOVA or nonparametric Kruskal-Wallis test at the last sampling points in the upper panels. n.s., not significant.
