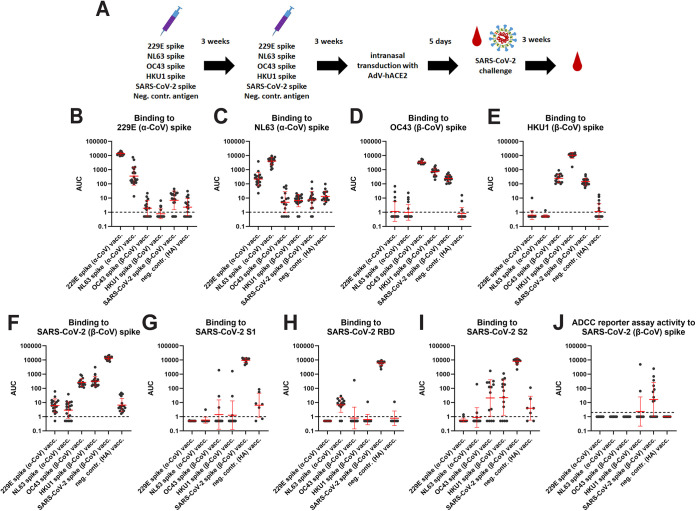
FIG 1.
Antibody reactivity against CoV spikes after vaccination. (A) Schematic of vaccination regimen, challenge and sampling. The red drop indicates bleeding time points. (B) Serum reactivity to 229E spike protein. (C) Serum reactivity to NL63 spike. (D) Serum reactivity to OC43 spike. (E) Serum reactivity to HKU1 spike. (F) Serum reactivity to SARS-CoV-2 spike. (G) Serum reactivity to SARS-CoV-2 S1. (H) Serum reactivity to SARS-CoV-2 RBD. (I) Serum reactivity to SARS-CoV-2 S2. (J) ADCC reporter activity to SARS-CoV-2 spike. The data for the pre-challenge sera are shown in B-J. 229E n = 18, NL63 n = 20, OC43 n-16, HKU1 n = 20, SARS-CoV-2 n = 19, neg. contr. n = 17, except for G to I, where n = 14 for all vaccinated groups and n = 7 for the control group and for J, where n = 15 for all groups. Significant statistical differences for B, C, D, E, F, and J are summarized in Table S1. Red bars indicate geometric mean, the error indicates the geometric standard deviation. Samples were analyzed once except for J where the mean of two replicates is shown.

