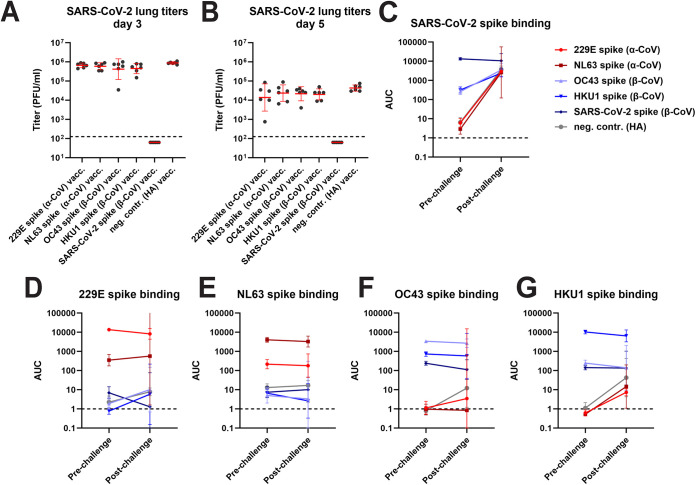
FIG 2.
Lung titers of CoV spike vaccinated animals post SARS-CoV-2 challenge and changes in antibody titer. Post challenge lung titers on day 3 and day 5 postchallenge are shown in (A) and (B). Changes in reactivity to SARS-CoV-2 spike, 229E spike, NL63 spike, OC43 spike and HKU1 spike after challenge are shown in (C) to G. For (A) and (B), n = 6 per group. The n for the prechallenge time points in (C) to (G) are described in the legend of Fig. 1. For the postchallenge time point, n = 3 for all groups except for NL63 where n = 2. Significant statistical differences are summarized in Tables S2 and 3, red bars indicate geometric mean, the error indicates the geometric standard deviation. For the remaining data panels the geometric mean plus 95% confidence intervals are shown. Samples were analyzed once.

