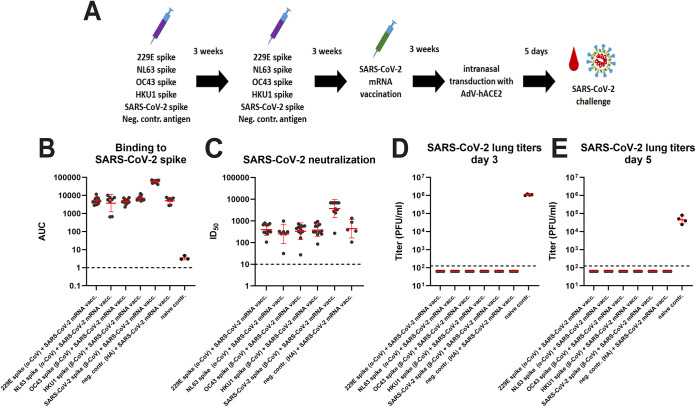
FIG 3.
Antibody reactivity post COVID-19 mRNA vaccination and postchallenge lung titers in CoV vaccinated animals. (A) Schematic of vaccination regimen, challenge and sampling. (B) shows binding titers to SARS-CoV-2 spike. The red drop indicates a bleeding time point. (C) shows neutralizing activity to authentic ancestral SARS-CoV-2. Post challenge lung titers on day 3 and day 5 postchallenge are shown in (D) and (E). The n for (B) was 12 for the 229E, OC43, and HKU1 groups, 8 for the NL63 group, 11 for the SARS-CoV-2 group, 7 for the negative control group, and 3 for the naive group. For (C) it was 12 for the 229E, OC43, and HKU1 groups, 7 for the NL63 group, 11 for the SARS-CoV-2 group and 5 for the negative control group. For D and E, n = 4 per group. Significant statistical differences are summarized in Table S4. Red bars indicate geometric mean, the error indicates the geometric standard deviation. Samples were analyzed once.

