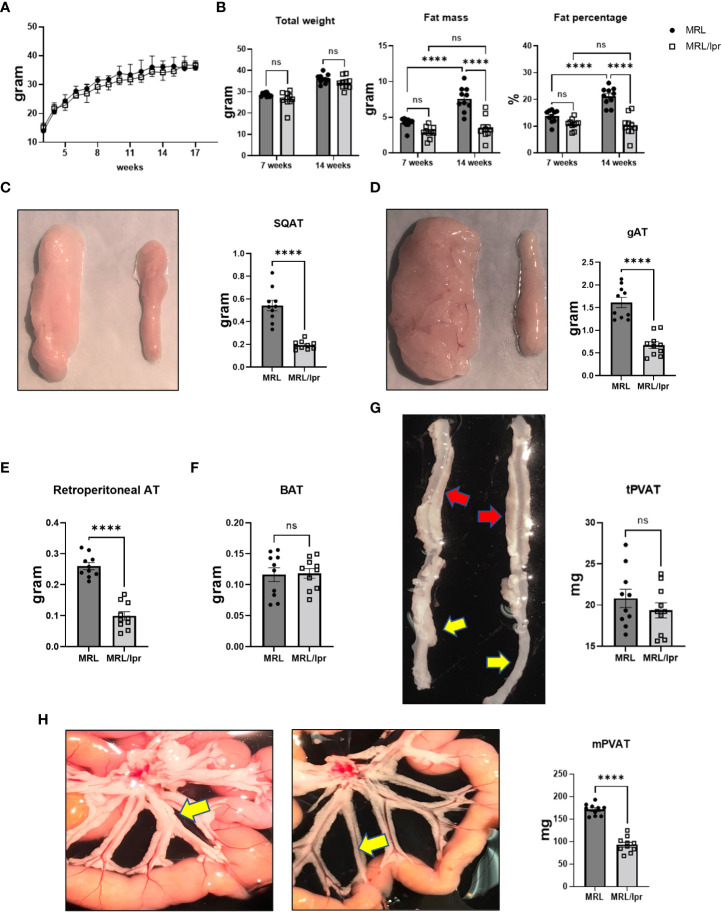
Figure 1.
MRL/lpr mice with active disease exhibited partial lipodystrophy. (A) Body weights were monitored weekly. (B) Total weight, fat mass and fat percentage at baseline (7 weeks) and with active disease (14 weeks) measured by NMR. (C-G) Representative images and weights of adipose tissue depots. Subcutaneous (SQAT, (C), gonadal (gAT, (D), retroperitoneal (E), brown (BAT, (F), thoracic aortic PVAT (tPVAT, red arrows, (G) and abdominal aortic PVAT (aPVAT, yellow arrows, (G) and mesenteric arterial PVAT (mPVAT, yellow arrows, (H). In all images, MRL tissues are depicted on the left and MRL/lpr on the right. n=10-15. ****p<0.0001 vs MRL (control). ns, not significant.

