
Fig. 4.
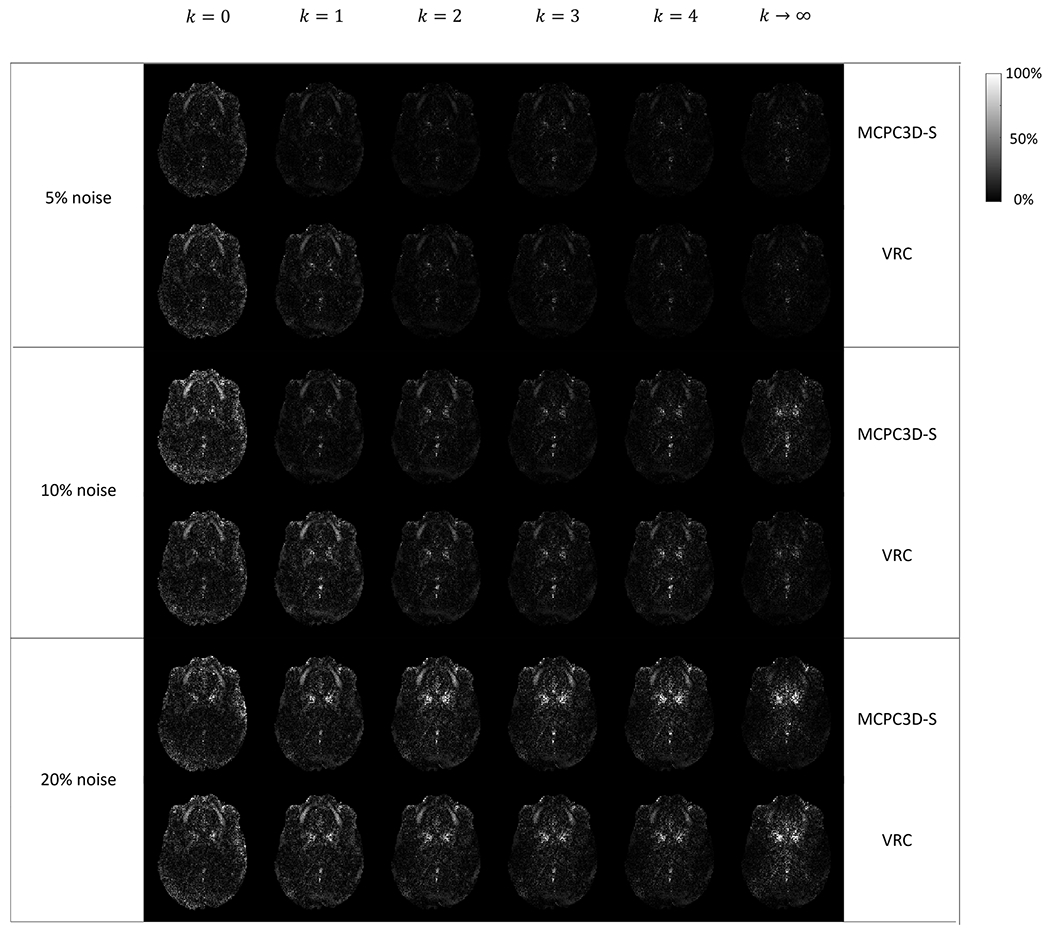
Relative difference (in %) maps between ground truth QSM and QSM maps processed following different phase reconstructions pipelines in the simulated data. Results are shown in one typical axial slice for three different noise levels (5%, 10% and 20%) and considering two phase matching algorithms (MCPC3D-S in the top and VRC in the bottom).