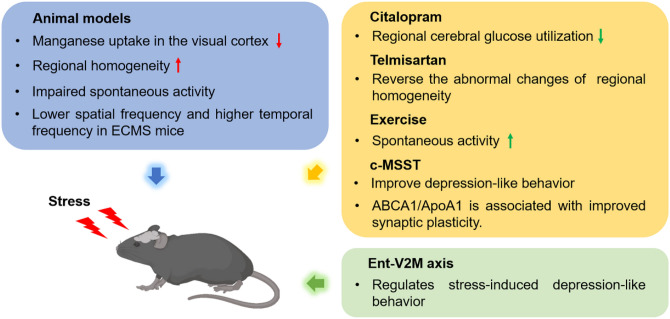
Fig. 3.
Visual cortical dysfunction in animal models of depression. The changes of neuronal activity, metabolism, synaptic plasticity, and neural circuits in the visual cortex in depressive animal models or after antidepressant treatment. Red upward arrows indicate an increase in animal models; red downward arrows indicate a decrease in animal models; green upward arrows indicate an increase after therapy; green downward arrows indicate a decrease after therapy. ABCA1, ATP-binding cassette transporter A1; ApoA1, apolipoprotein A1; c-MSST, combined magnetic stimulation system treatment; ECMS, early-life chronic mild stress; Ent, entorhinal cortex; V2M, secondary visual cortex.

