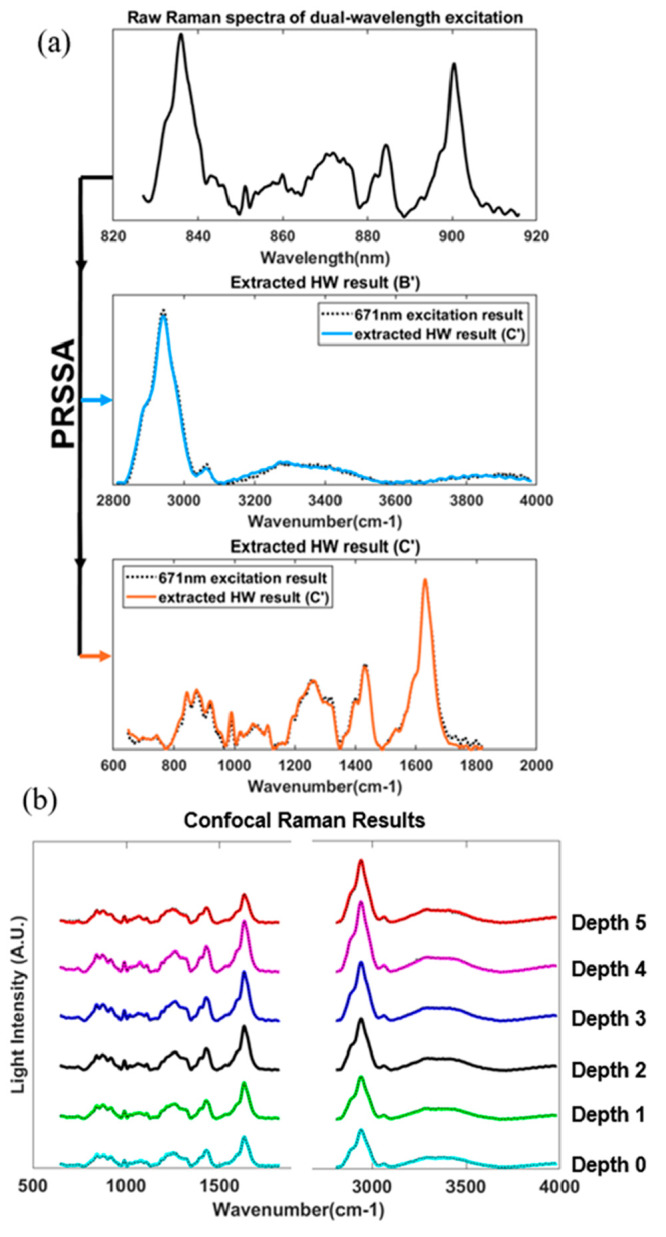
Figure 4.

(a) Extracted spectra from the raw signal by PRSSA, representing the Raman spectra with the 671 nm excitation laser (blue) and 785 nm excitation laser (orange). (b) Extracted FP and HW Raman spectra at different depths, Depth 0 is the skin surface, and the reference spectra are shown as black dotted curves.
