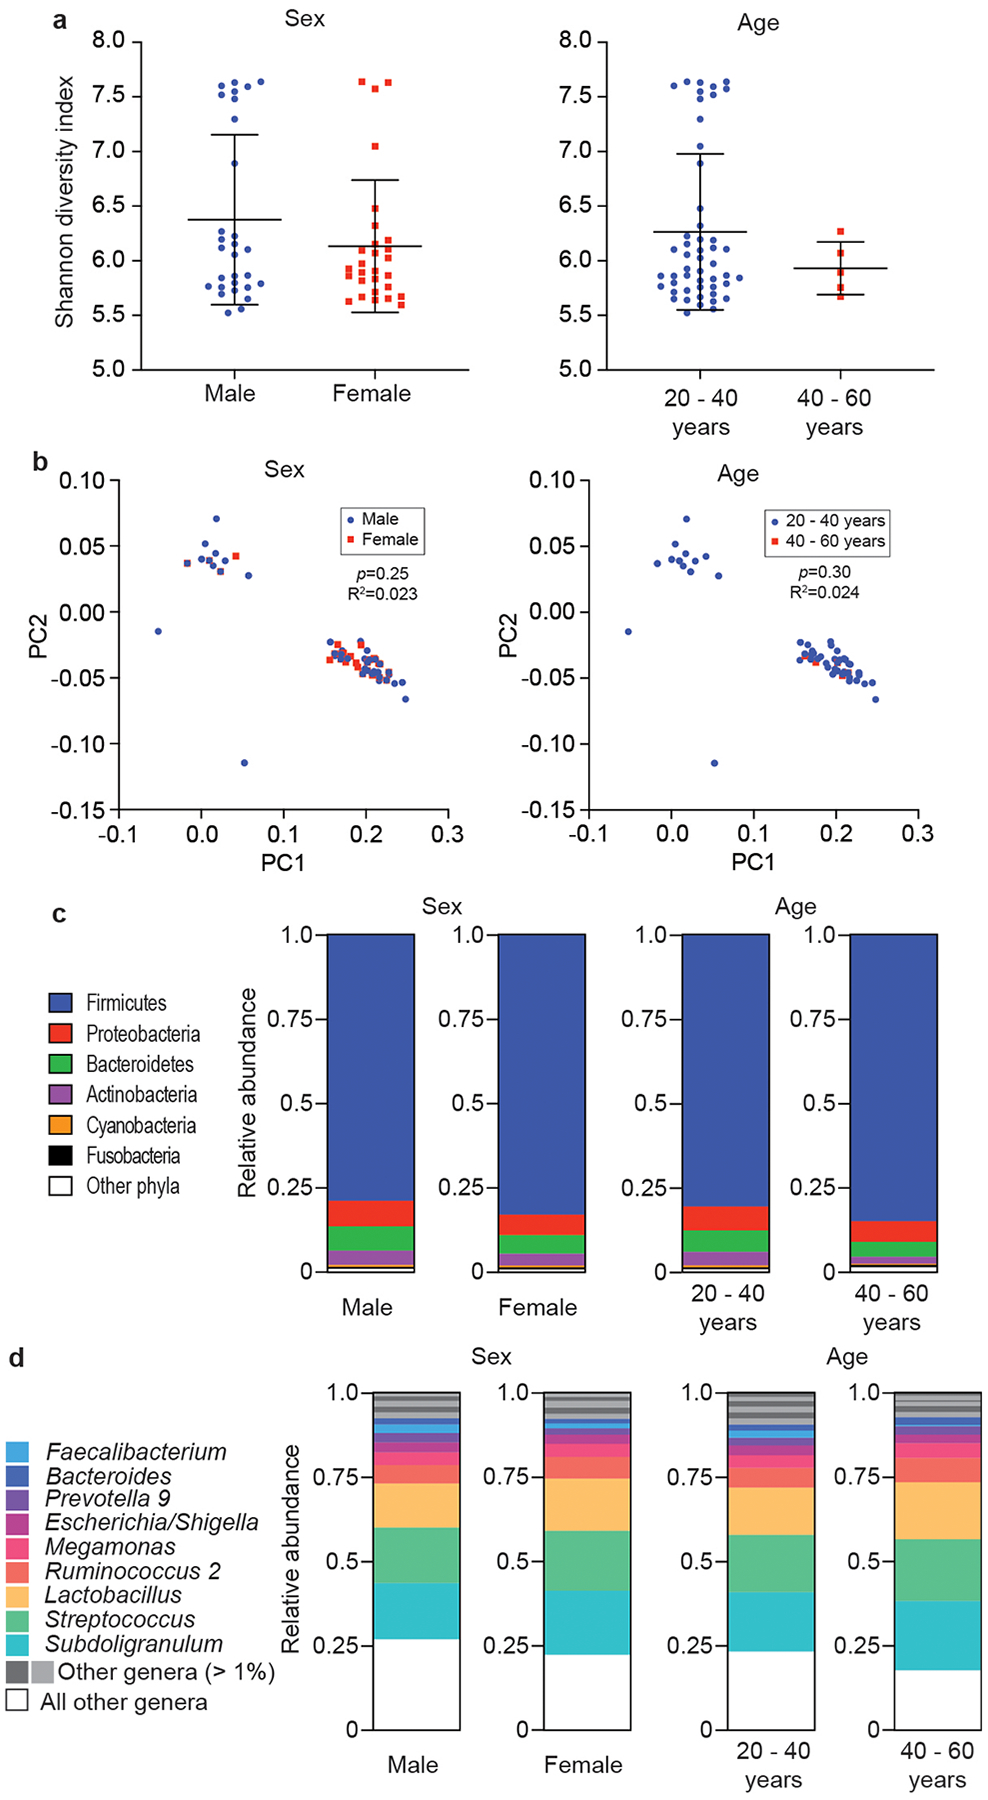
Extended Data Fig. 6. Microbiome analysis by sex and age of participants.

a, α-diversity (Shannon indices). Statistical analysis is by two-tailed Mann-Whitney tests. Error bars show the mean ± SD. b, β-diversity (PCoA analyses). Statistical analysis is by Adonis. c, Relative abundances on the phylum level. d, Relative abundances on the genus level. a-d, n=55 (all AR).
