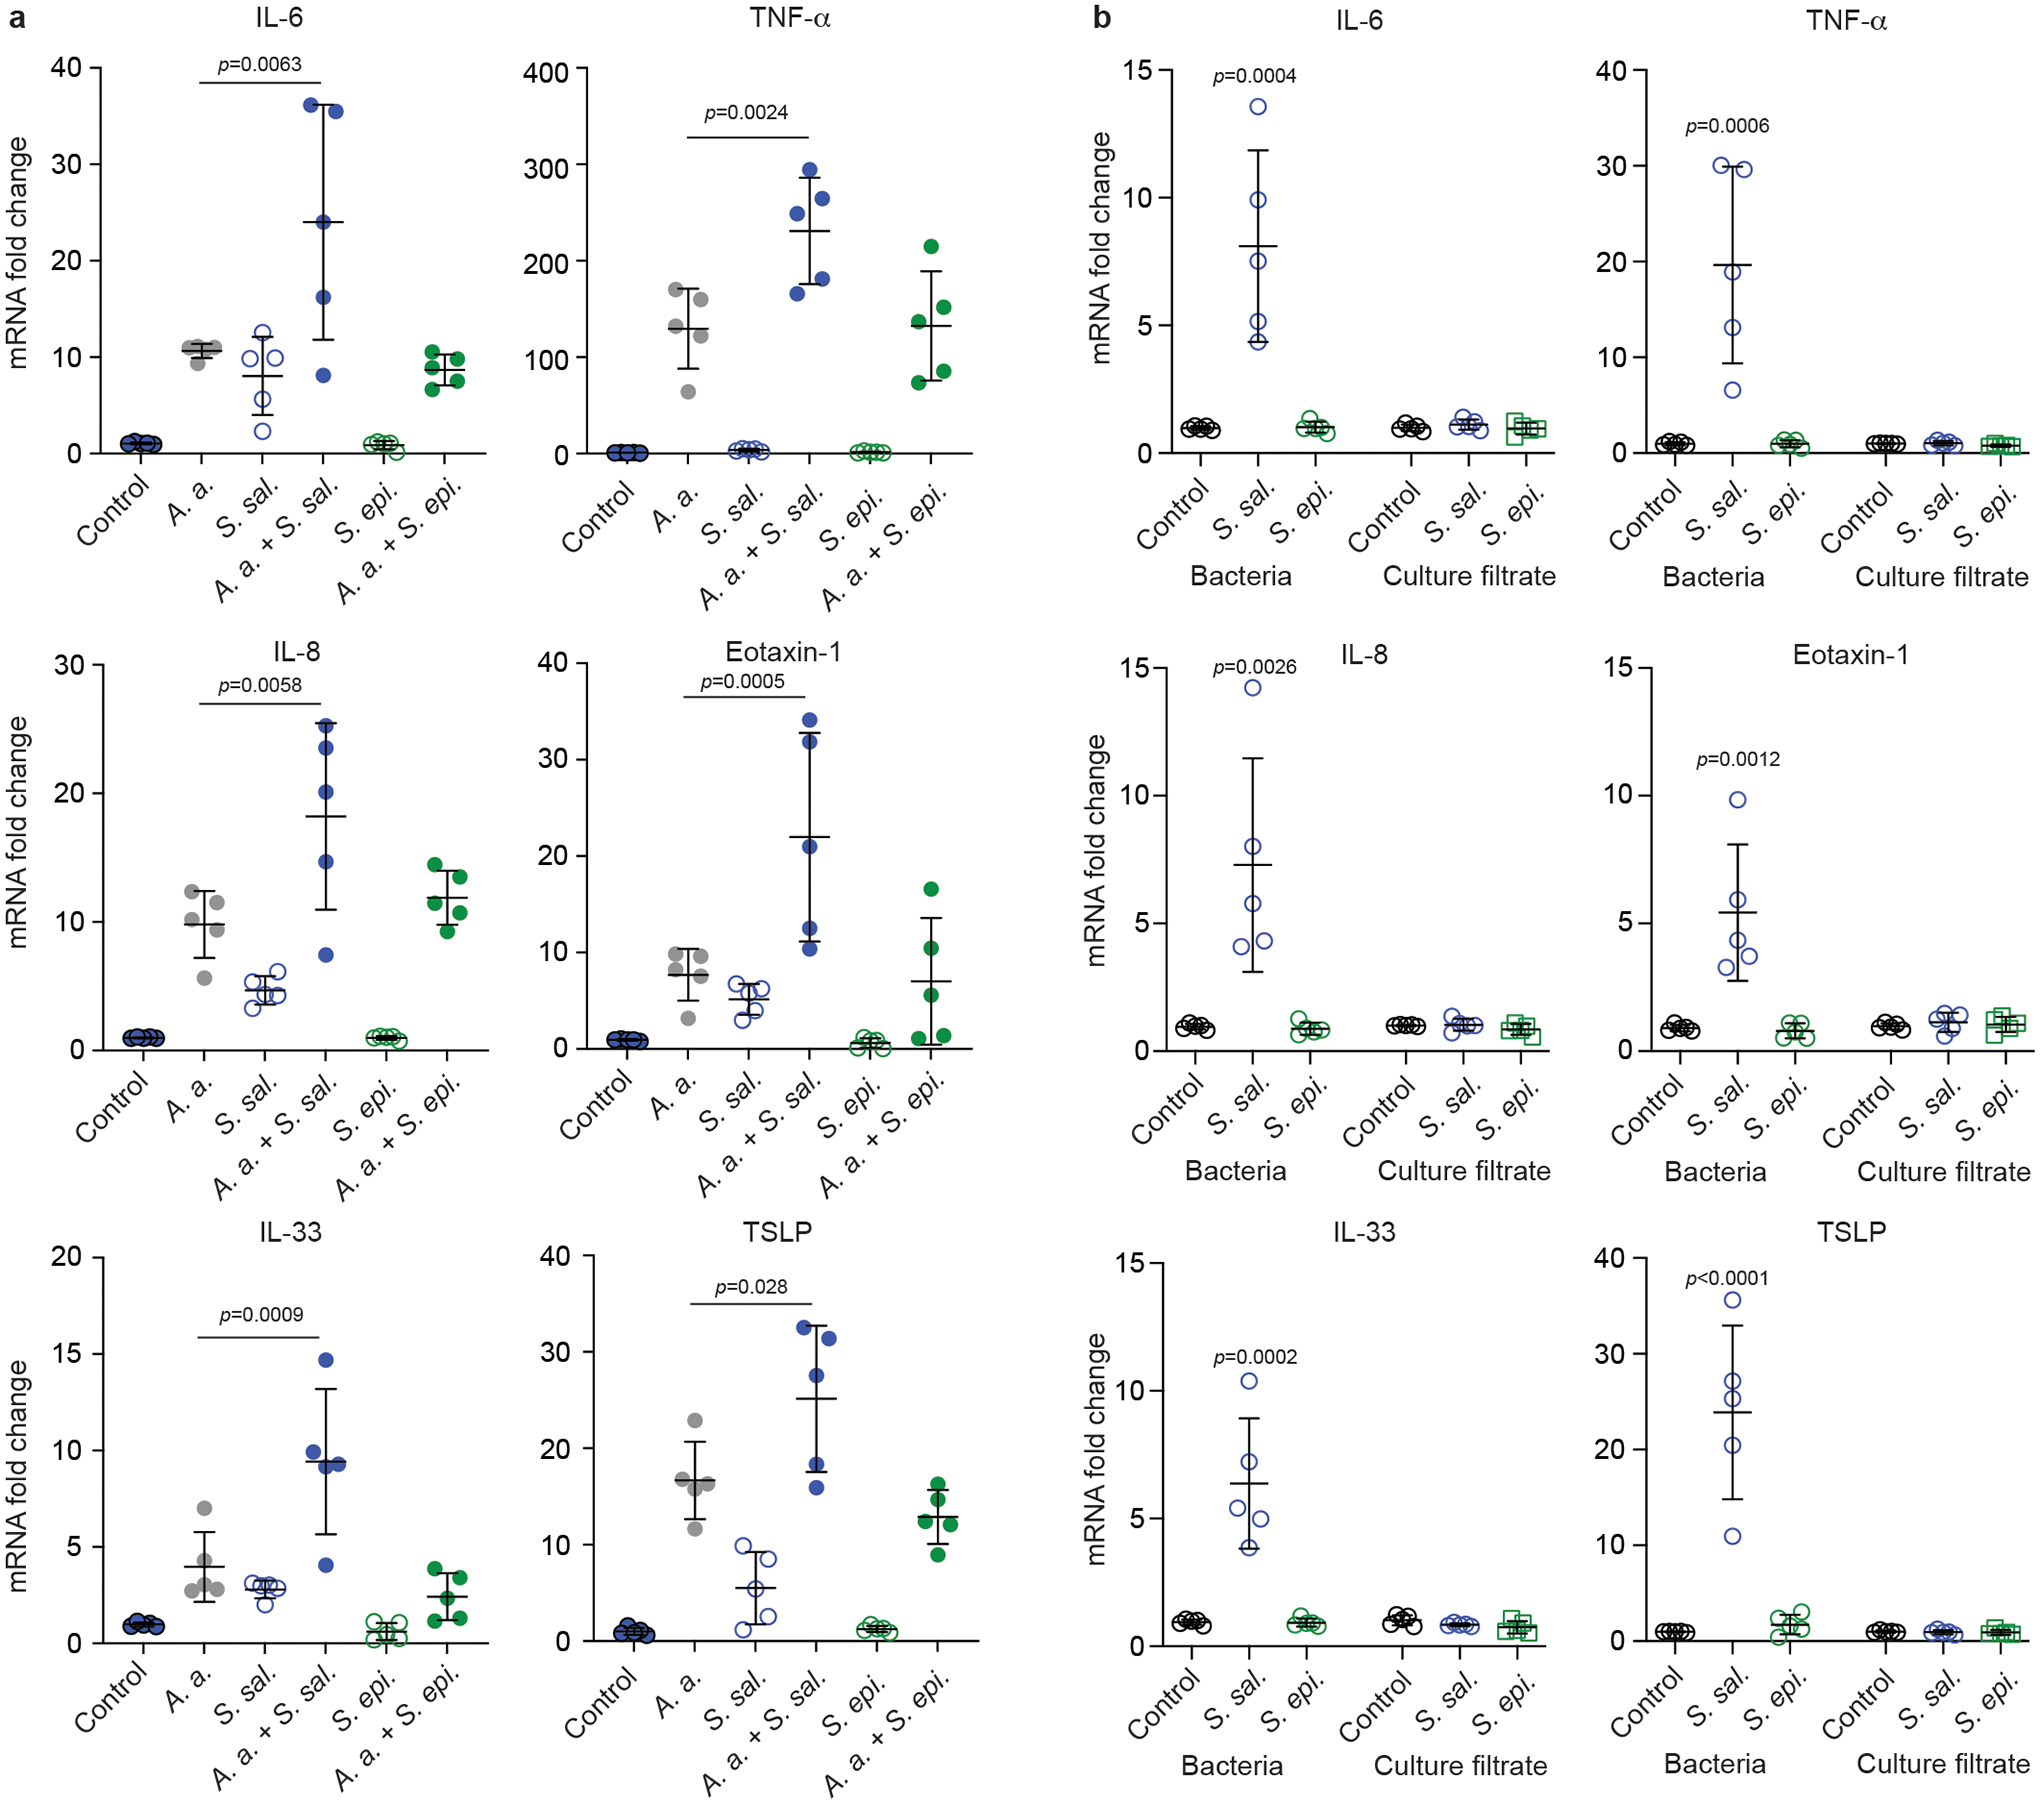
Fig. 3. S. salivarius promotes cytokine gene expression in allergen-induced epithelial cells.

a, A549 epithelial cells were exposed to 1 × 10⁴ CFU of S. salivarius (S. sal.) or S. epidermidis (S. epi.) isolates (n=5/group) for 24 h with and without stimulation by A. alternata (A. a.) and cytokine expression was determined by qRT-PCR. Statistical analysis is by 1-way ANOVAs with Tukey’s post-tests. Results for the comparisons of A. a. versus A. a. + S. sal. and A. a. + S. epi and of control versus S. sal and S. epi are shown. Not specified comparisons were not significant (p ≥ 0.05). b, Comparison of effects exerted by culture filtrate and bacteria of the same isolates. “Bacteria” values were obtained as in a. For “culture filtrate” values, 1 × 10⁴ CFU of S. salivarius or S. epidermidis were incubated in 10% DMEM for 24 h, then culture filtrates were collected and added to the monolayer of A549 cells for another 24 h and cytokine expression was determined by qRT-PCR. Statistical analysis is by 1-way ANOVA with Dunnett’s post-test versus control within the culture filtrate and bacteria groups. Not specified comparisons were not significant (p ≥ 0.05). Error bars show the mean ± SD.
