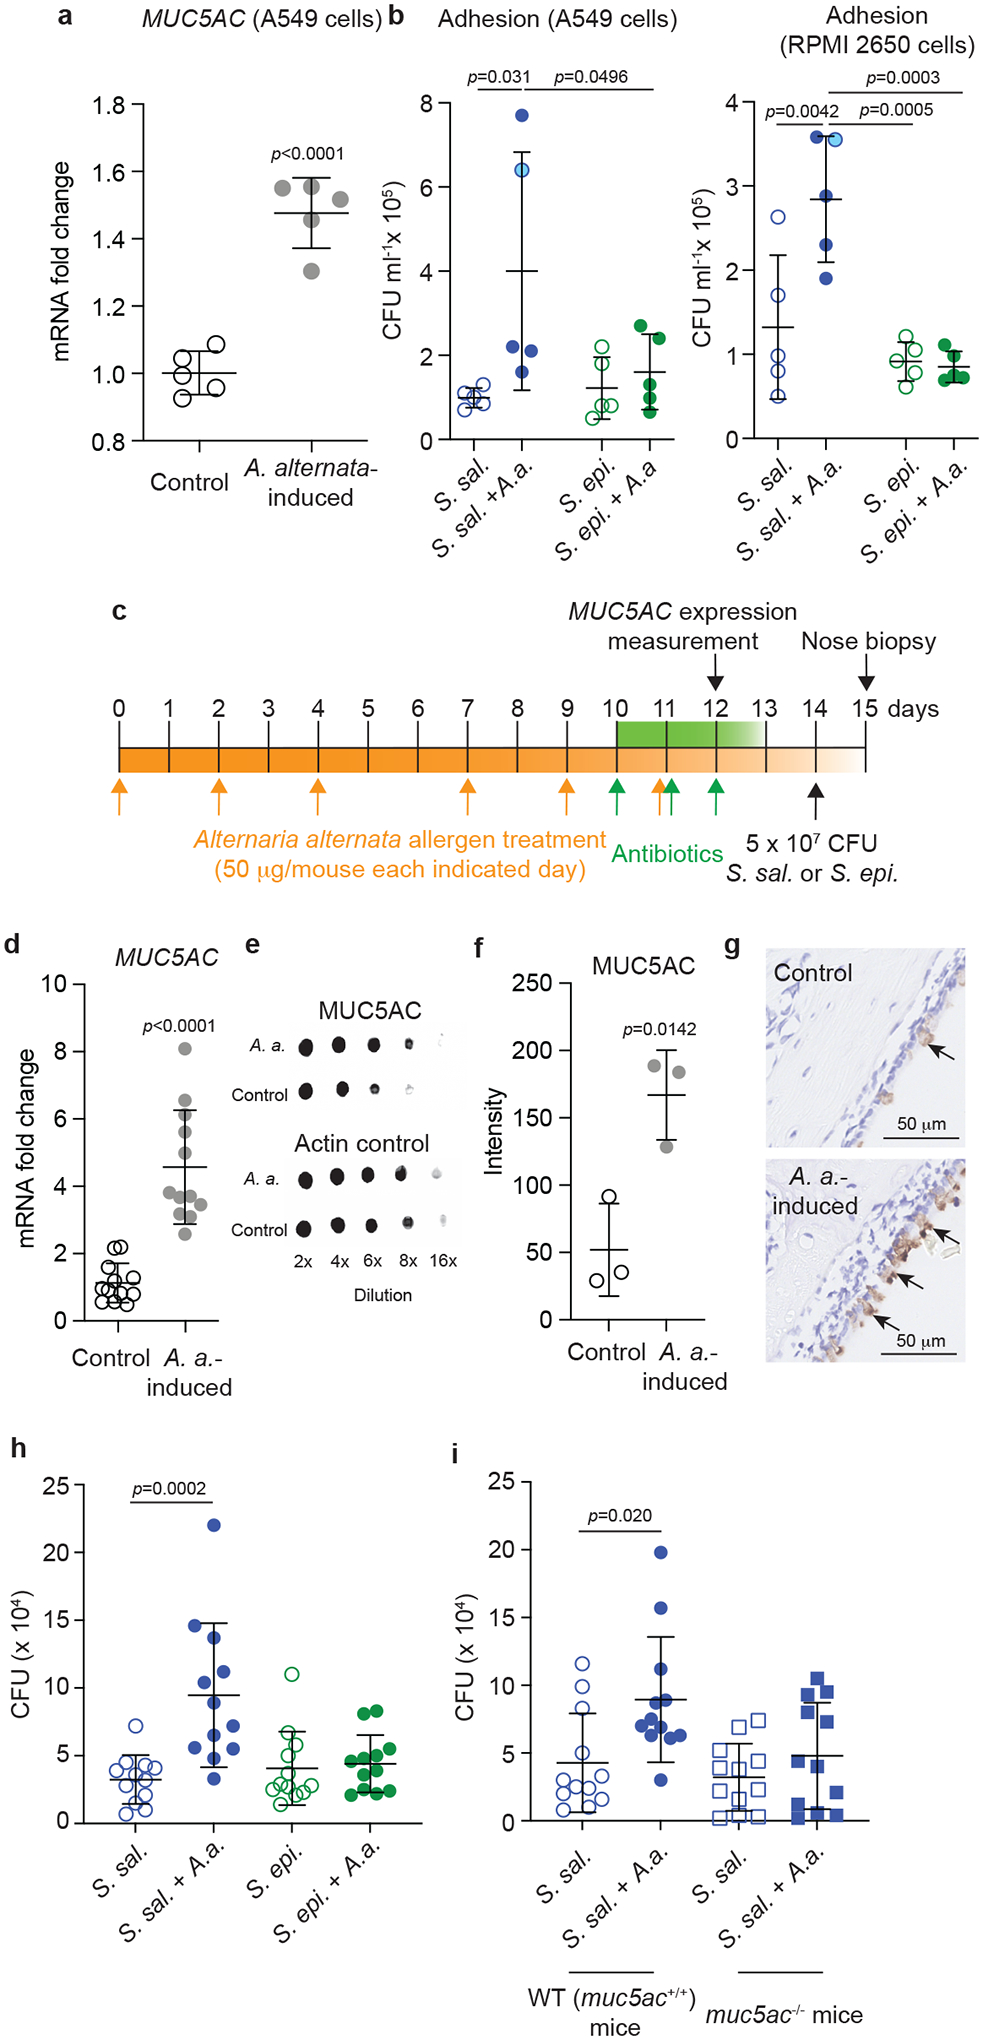
Fig. 4. S. salivarius shows strong adhesion to nasal epithelia under allergen-induced conditions.

a, Expression of the MUC5AC gene in control and A. alternata-induced A549 epithelial cells. n=5/group (same isolates as in Fig. 3). b, Adhesion of S. salivarius (S. sal.) or S. epidermidis (S. epi) isolates (same isolates as in Fig. 3), with and without A. alternata (A.a.) induction, to A549 and RPMI 2650 epithelial cells. Values shown are averages of n=3 independent replicates per isolate. Statistical analysis is by 1-way ANOVAs with Tukey’s post-tests. Blue circle symbols with light blue filling are used for the values of the S. salivarius isolate chosen for the in vivo experiment in panels c-i. c, Mouse colonization model under allergen-induced conditions. C57BL/6J (or C57BL/6NCrl mice in the experiment comparing to C57BL/6NCrl MUC5AC−/− mice) were inoculated intranasally with 50 μg in 5 μl A. alternata extract on days 0, 2, 4, 7, 9, and 11, while mice in the control group received PBS instead (n=12/group for MUC5AC expression and nose biopsies; n=3 for MUC5AC protein level assays). From day 10, the mice received antibiotics to eradicate the preexisting microbiota once daily for 3 days. On day 14, 5 × 10⁷ CFU of S. salivarius or S. epidermidis in 10 μl PBS were instilled intranasally (5 μl per nostril). 24 hours later, the mice were euthanized, noses were homogenized, and CFU were counted. d, Expression of the MUC5AC gene in nasal epithelia at day 12 (one day after the end of the A. alternata treatment). e,f, Analysis of MUC5AC protein expression by immuno-dot blots (e, example pictures, f, densitometry of dots obtained at 8 × dilution). g, Immunohistochemical detection of MUC5AC protein in the nasal epithelium. Arrows point to positive reaction (brown color). A picture representative of pictures taken in three mice is shown. h, Determination of CFU in the nose after biopsy in the experiment comparing S. salivarius and S. epidermidis. i, Determination of CFU in the nose after biopsy in the experiment with S. salivarius comparing control (MUC5AC+/+) to MUC5AC−/− mice. a,d,f, Statistical analysis is by unpaired, two-tailed t-tests. b,h,i, Statistical analysis is by 1-way ANOVAs with Tukey’s post-tests. a,b,d,f,h,i, Error bars show the mean ± SD.
