
Extended Data Fig. 1. Analysis of group composition.
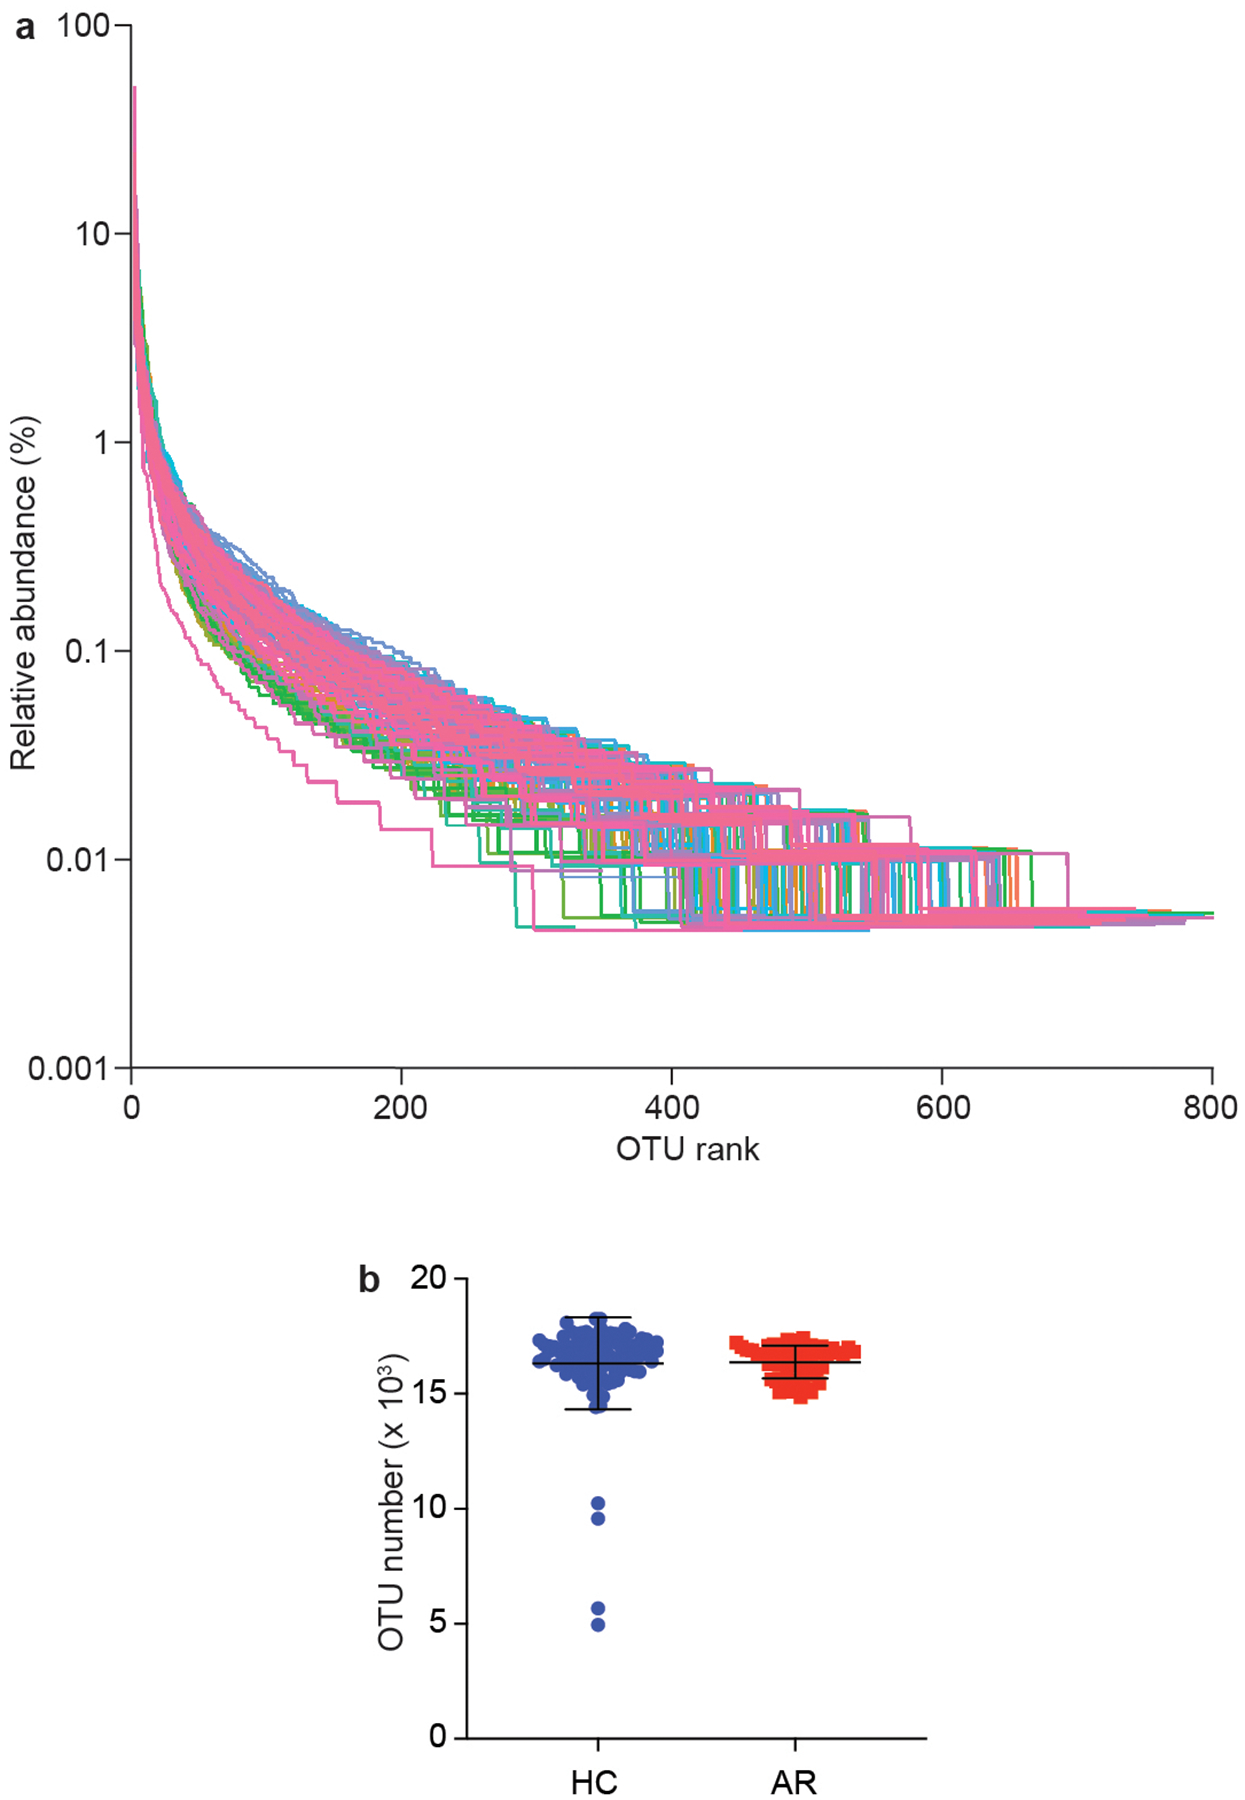
a, Relative species abundance and evenness by rank abundance (Whittaker) plots. b, Total OTU in HR and AC groups. Statistical analysis is by two-tailed Mann-Whitney test. Error bars show the mean ± SD. n=55 (AR), n=102 (HC).