
Figure 5.
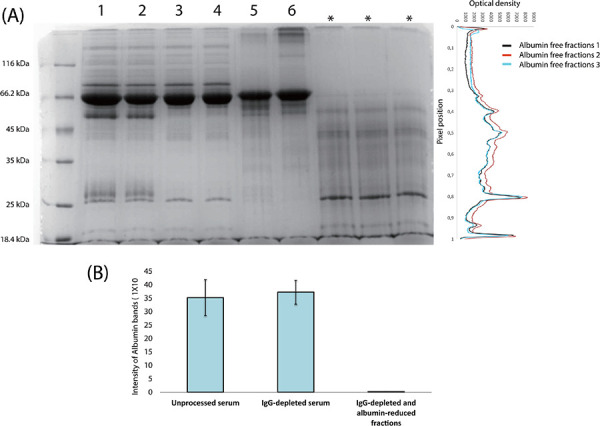
(A) SDS-PAGE analysis of the proteins from unprocessed serum samples (Lanes 1 and 2), IgG-depleted flow-through fractions from the protein G column (Lanes 3 and 4) and albumin-containing fractions eluted from preparative gel fractions (Lanes 5 and 6). The last three lanes marked with asterisks were run to demonstrate the absence of IgG and albumin bands in IgG-depleted and albumin-reduced serum samples. (B) Graphic representation of the albumin reduction. The graph was generated by measuring the intensities of albumin bands on the gels using Quantity One software.