Figure 7.

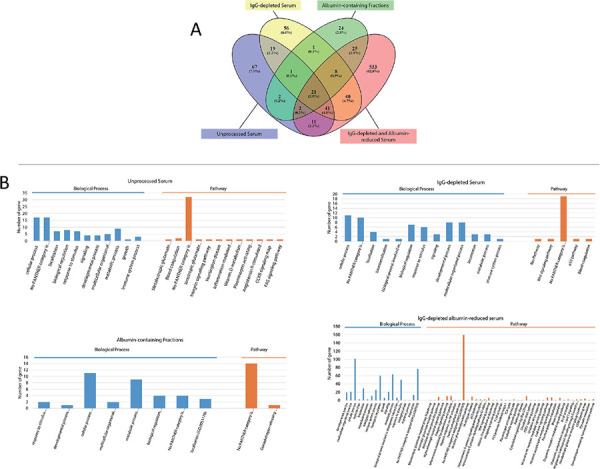
(A) Venn diagram of low abundant proteins. (B) PANTHER analyses of group specific low abundant proteins which was presented as biological processes and pathways.

(A) Venn diagram of low abundant proteins. (B) PANTHER analyses of group specific low abundant proteins which was presented as biological processes and pathways.