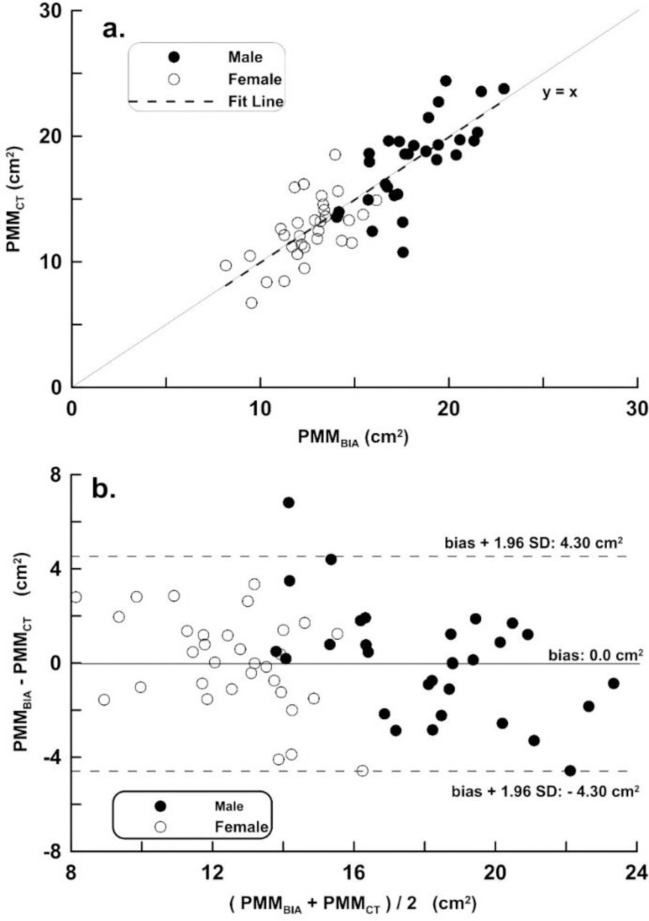
Fig 3. Scatter and Bland-Altman diagram of modeling group.
Correlation analysis (top) and difference analysis (bottom) between psoas major muscle (PMM) by computed tomography (PMMCT) and bioimpedance analysis (BIA) in the modeling group (MG). The difference (PMMCT−PMMBIA of Bland-Altman) is the mean of the corresponding measurements of PMM to CT and BIA. Black filled circles represent males and black open circles represent females.

