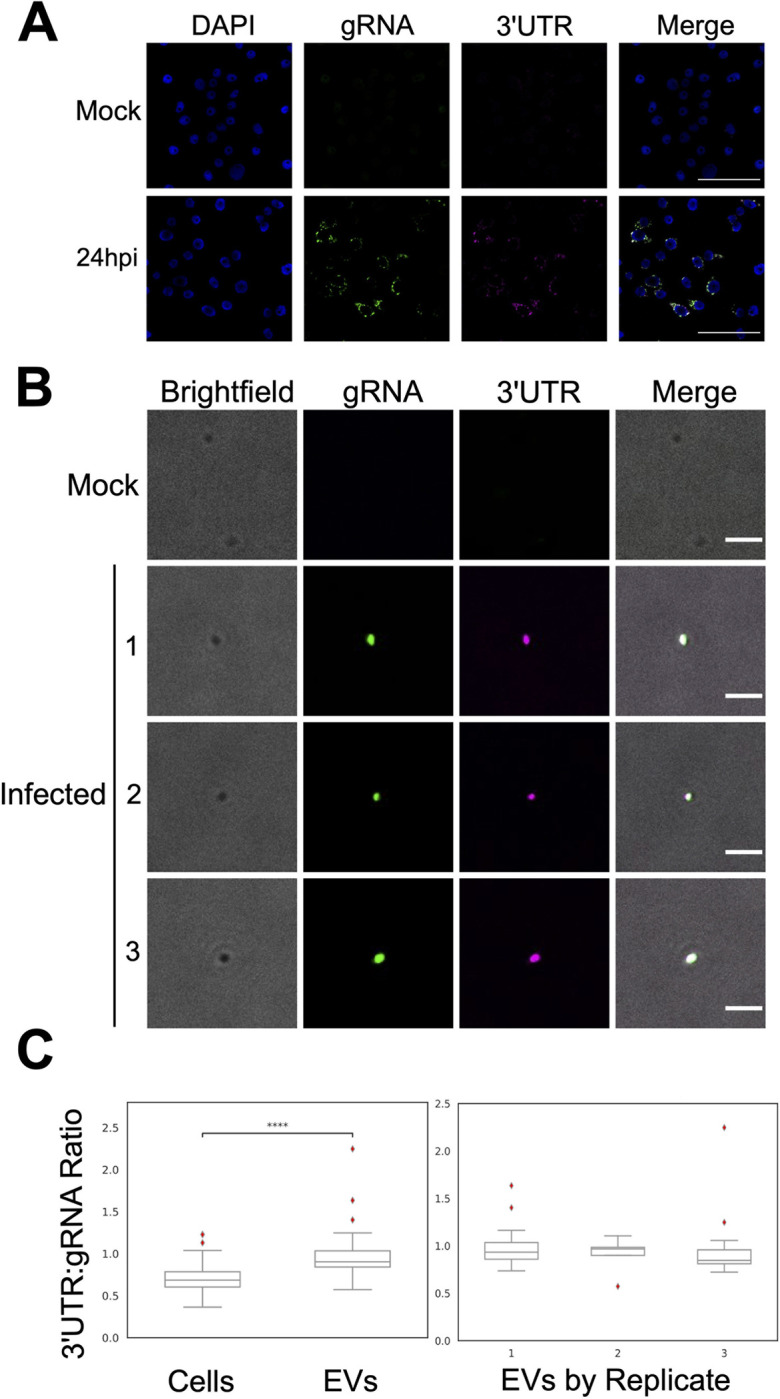
Fig 3. Mosquito salivary EVs are enriched in DENV2 3’UTR RNA, relative to infected cells.

(A) Representative images of nuclei (blue), DENV2 gRNA (green), and DENV2 3’UTR (magenta) from C6/36 cells 24 h.p.i. with DENV2 NGC at an MOI of 0.3. Scale bar, 50 μm. (B) Representative images of EVs imaged in brightfield (grey), DENV2 gRNA (green), and DENV2 3’UTR (magenta) from Ae. aegypti saliva collected 10 days post inoculation with DENV2 NGC. Scale bar, 2 μm. (A & B) RNA-FISH of DENV2 gRNA and 3’UTR labelled with Oligopaints probes. (C) Ratios of DENV2 3’UTR: gRNA fluorescence signals as detected via RNA-FISH in DENV2 NGC infected C6/36 cells and EVs from Ae. aegypti saliva (left). Ratios of DENV2 3’UTR: gRNA fluorescence signals as detected via RNA-FISH on EVs from Ae. aegypti saliva from the three independent labelling experiments (right). ****, p ≤ 10−4 as determined by a two-sided Mann-Whitney U test. Exact p-value = 1.79 x 10⁻¹². NCells = 102; NEVs = 35.
