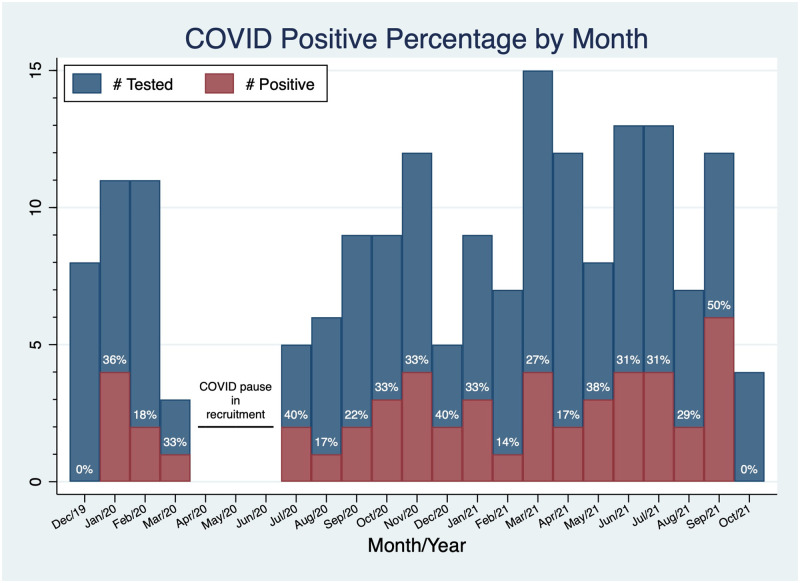
Fig 2. Histogram of SARS-CoV-2 infections by month of enrollment (both NYC and Boston sites).
Cases are illustrated as red shaded area and total number of tested samples/enrolled subjects shaded in blue. The SCAN-MP study did not enroll during a 3 month period corresponding to the first COVID-19 surge. Note the high proportion of positive cases in January 2020, prior to recognition of community spread.

