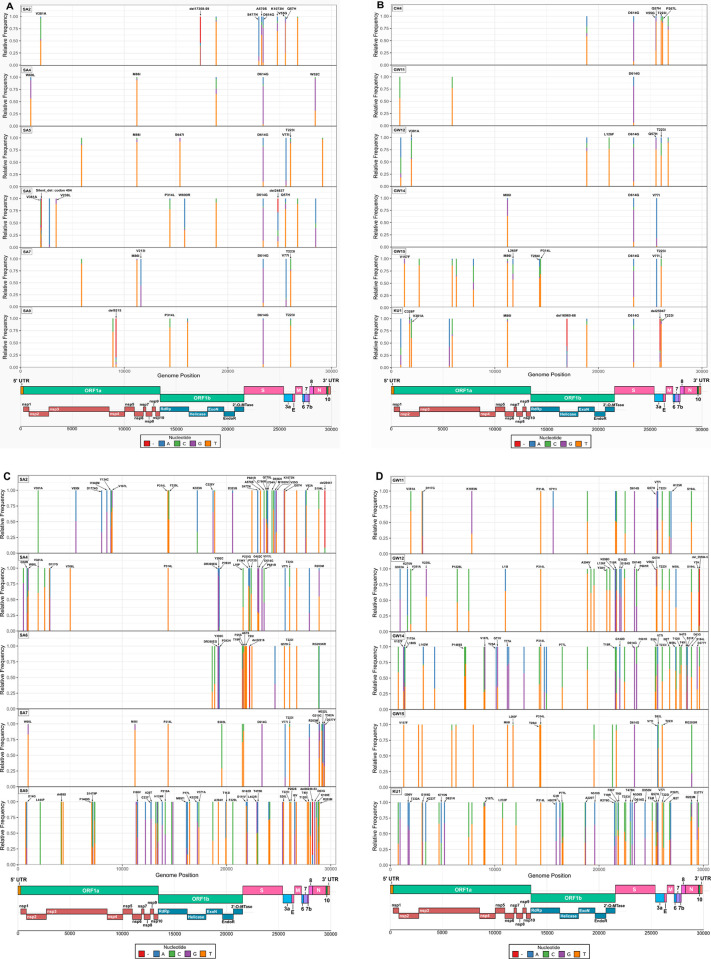
Fig 4. Key Distribution of mutations, both synonymous and nonsynonymous, including nucleotide deletions across the full-length genomes of SARS-CoV-2 from wastewater samples collected in this study.
Nucleotide frequencies at each nucleotide position of the mutations are indicated with different colors (shown in key) to show nucleotide variation in the reads generated during sequencing, obtained using Geneious Prime 2020.2.3. (A, B) indicates nucleotide frequency of mutations, generated during Nanopore MinION sequencing of the 12 wastewater samples collected in the study. (C, D) indicates nucleotide frequency of mutations, generated during Illumina MiSeq sequencing of 10 of the wastewater samples. The SARS-CoV-2 genome organization is schematically represented on the bottom of the plots. Amino acid mutations, SNPs and deletions have been annotated on the plot according to the presence of significant nucleotide frequency changes on each position, with the exclusion of labels for synonymous nucleotide mutations.

