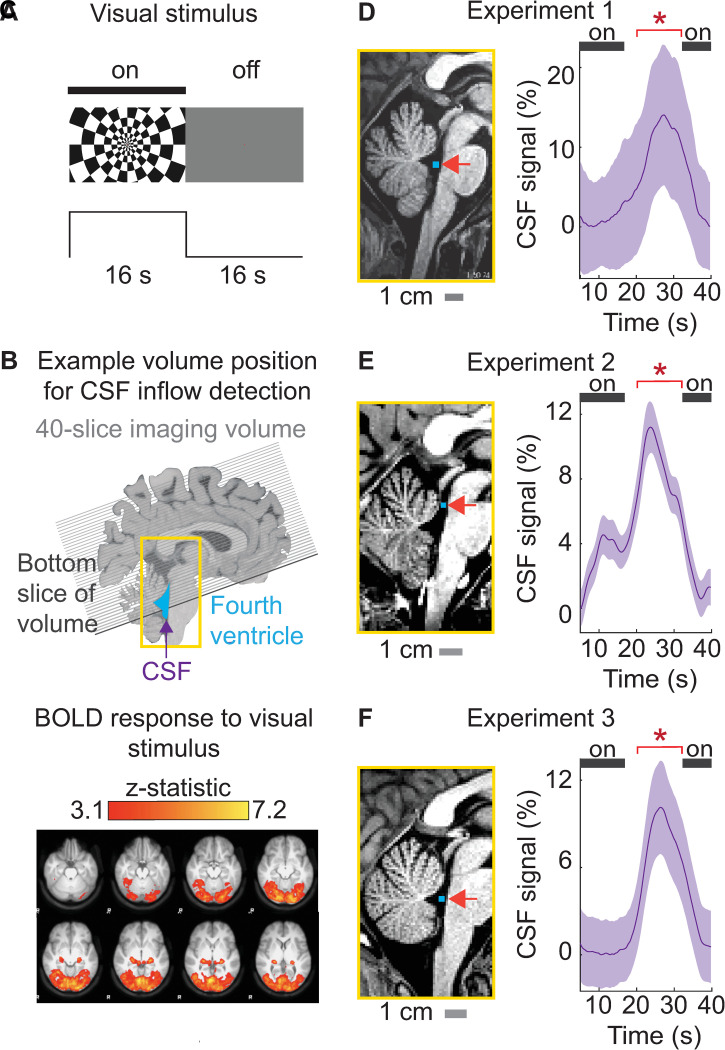
Fig 1. High-intensity visual stimulation drives significant cerebrospinal fluid inflow in the fourth ventricle and aqueduct.
(A) Example frames from the block-design visual stimulus. “On” blocks consisted of a flickering radial checkerboard. “Off” blocks consisted of a gray screen. (B) The analysis extracted the CSF inflow signal measured in the fourth ventricle (blue) moving upwards (purple arrow) into the functional acquisition volume. The black line indicates an example position of the bottom slice of functional volume through the fourth ventricle, to enable upwards CSF flow detection. (C) Map in MNI space of widespread cortical activation in response to block-design checkerboard visual stimulus in n = 16 subjects in Experiment 3. Z-statistic values were thresholded at a level of 3.1 and corrected voxel-wise for multiple comparisons (p < 0.05). (D) Left: Example placement of CSF ROI (blue) in the fourth ventricle in 1 subject in Experiment 1. Right: Average evoked CSF inflow signal locked to the visual stimulus across subjects in Experiment 1 (n = 6). (E) Left: Example placement of the CSF ROI in Experiment 2, in the upper ventricle and aqueduct. Right: Average evoked CSF inflow signal across subjects in Experiment 2 (n = 20). (F) Left: Example placement of CSF ROI in Experiment 3, in the fourth ventricle. Right: Average evoked CSF inflow across subjects in Experiment 3 (n = 16). The black bar indicates “on” blocks. Shading indicates standard error across subjects. The time periods with significant increases in CSF flow signal amplitude are marked with * (p < 0.05, Wilcoxon signed-rank test). Traces are smoothed in a sliding 5-s window. Data from: doi:10.18112/openneuro.ds004478.v1.0.0 (Experiment 1), doi:10.18112/openneuro.ds004484.v1.0.0 (Experiment 2), and doi:10.18112/openneuro.ds004493.v1.0.0 (Experiment 3). BOLD, blood-oxygenation-level-dependent; CSF, cerebrospinal fluid; ROI, region of interest.

