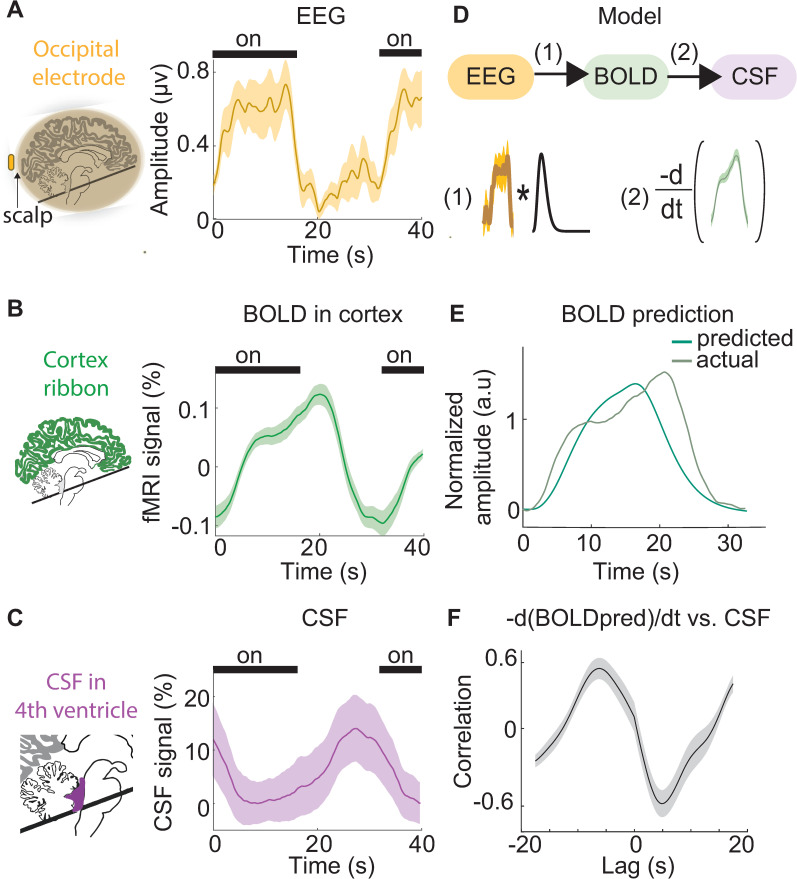
Fig 2. The temporal sequence of simultaneously measured neural, hemodynamic, and CSF signals.
(A) The average amplitude envelope (orange) of stimulus-locked occipital EEG shows consistent neural responses during the visual stimulus (n = 12 runs, 6 subjects). (B) The average global cortical response (green) shows the stimulus induces a global increase in BOLD detectable in the cortical gray matter ROI. (C) The average CSF inflow signal (purple) shows consistent upwards flow after stimulus offset, when BOLD is decreasing. Shading in all panels indicates the standard error across 12 task runs. Black bars indicate stimulus ON blocks. Time t = 0 is the onset of a 16-s ON block. (D) A schematic of the model for predicting CSF flow using neural signals. The EEG envelope amplitude (orange) is convolved with a standard hemodynamic response function (black). The negative temporal derivative of the predicted hemodynamic signal (green) is then used to predict CSF flow. (E) The predicted BOLD signal produced by convolution overlaid on the actual BOLD signal. (F) The cross-correlation between the negative derivative of the predicted BOLD signal and CSF signal, showing that model predictions correlate with observed CSF flow. Shading is standard error across subjects (n = 6). Data from: doi:10.18112/openneuro.ds004478.v1.0.0. BOLD, blood-oxygenation-level-dependent; CSF, cerebrospinal fluid; EEG, electroencephalogram; ROI, region of interest.

