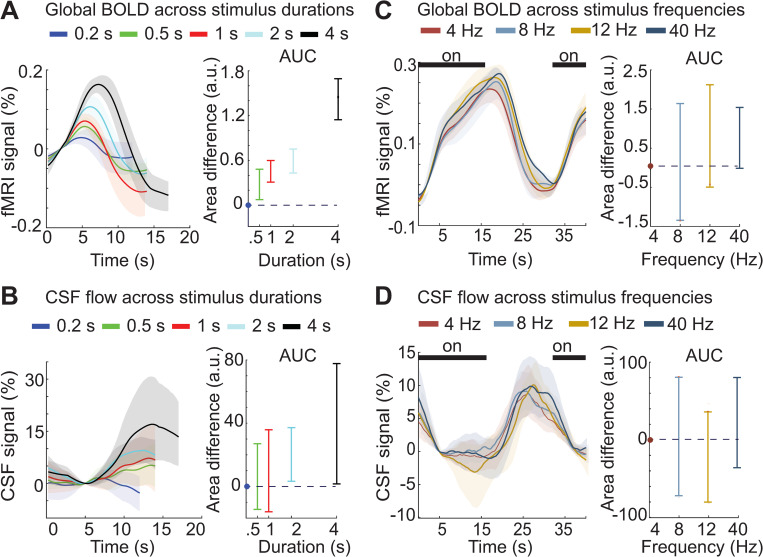
Fig 3. CSF responses match cortical hemodynamic responses across a range of stimulus parameters.
(A) Left: Traces show the mean deconvolved cortical responses across subjects for each stimulus duration (n = 105 runs, 12 subjects). Colors represent the duration (0.17–4 s) of ON blocks, consisting of a 12-Hz flickering checkboard. Shading represents the 95% confidence intervals (bootstrap analysis). Right: The average area under the curve of the cortical BOLD response increases as a function of stimulus duration. Error bars represent the 95% confidence interval (bootstrap analysis, Bonferroni corrected). (B) Left: Traces are the mean deconvolved CSF flow signals for each stimulus duration. Shading represents the 95% confidence intervals (bootstrap analysis). Right: The average area under the curve of the CSF response increases as a function of stimulus duration, matching the pattern seen in BOLD. Error bars represent the 95% confidence interval (bootstrap analysis, Bonferroni corrected). (C) Left: Average stimulus-locked cortical responses across stimulus flicker frequencies. Shading indicates standard error across subjects (n = 143 runs, 16 subjects). Right: Average difference in the area under the curve of the cortical BOLD response for the 3 higher stimulus frequencies with the 4-Hz condition. Error bars show the 95% confidence intervals (bootstrap, Bonferroni corrected). (D) Left: Average stimulus-locked CSF responses also show no significant change across flicker frequencies. Shading indicates standard error across subjects. Right: Average area under the curve for the CSF responses does not change significantly across stimulus frequencies. Error bars represent the 95% confidence interval (bootstrap, Bonferroni corrected). Dashed lines indicate y = 0; dots indicate the value used to normalize area for each subject, which was the shortest duration (0.17 s) or the lowest frequency (4 Hz). Data from: doi:10.18112/openneuro.ds004484.v1.0.0 (Experiment 2), doi:10.18112/openneuro.ds004493.v1.0.0 (Experiment 3). BOLD, blood-oxygenation-level-dependent; CSF, cerebrospinal fluid.

