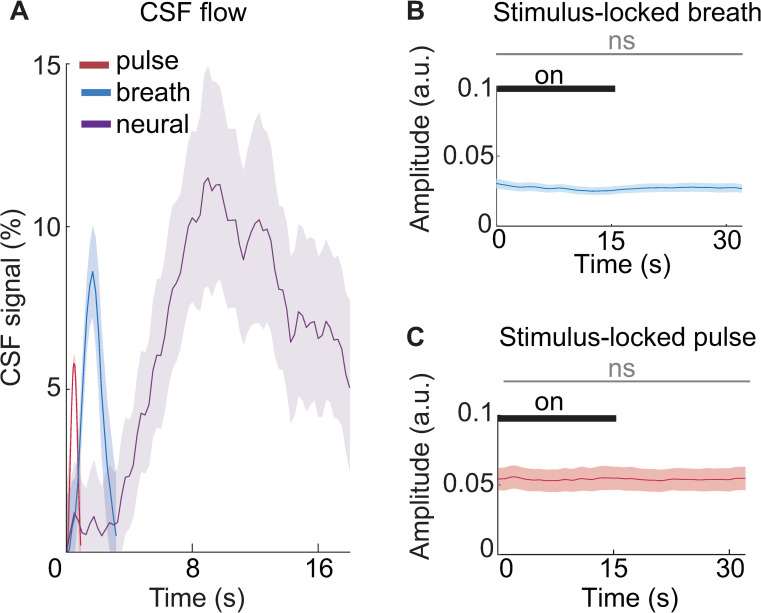
Fig 4. Neurally driven CSF flow signals during the visual task have comparable magnitude to flow signals driven by systemic physiology.
(A) Average CSF flow locked to breath cycle (blue), cardiac cycle (red), and visual stimulus offset (purple), with no temporal smoothing. The breath and cardiac cycles were scaled by the average length of a single cycle (average breath cycle length = 3.16 s; average cardiac cycle length = 0.9 s). Shading is standard error across subjects (n = 16). (B) The average amplitude envelope of the respiration signal shows no significant change linked to the visual stimulus. Shading indicates standard error across subjects (n = 16). (C) The average amplitude envelope of the pulse oximeter signal shows no significant change locked to the stimulus. Shading indicates standard error across subjects (n = 16). The gray bar indicates that variations in the signal amplitude between stimulus on and off blocks were not statistically significant. Data from: doi:10.18112/openneuro.ds004493.v1.0.0. CSF, cerebrospinal fluid.

