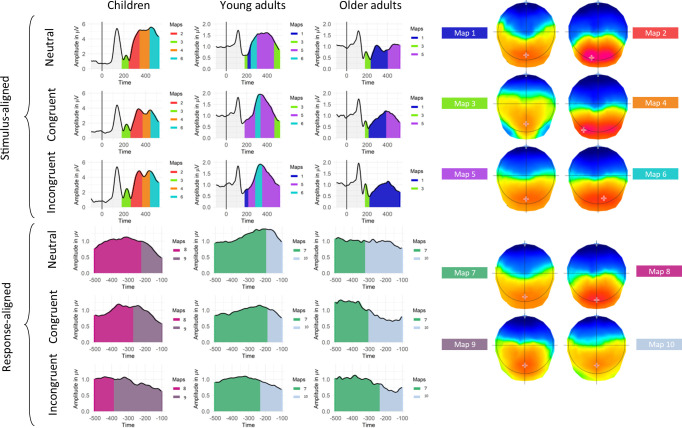
Fig 4. Periods of stability of the electric field at the scalp are represented under the GFP curve of the grand average ERPs with color codes for stimulus-and-response-aligned signal, for each age group and condition.
The corresponding template maps are displayed on a continuum from red (positive) to blue codes (negative).

