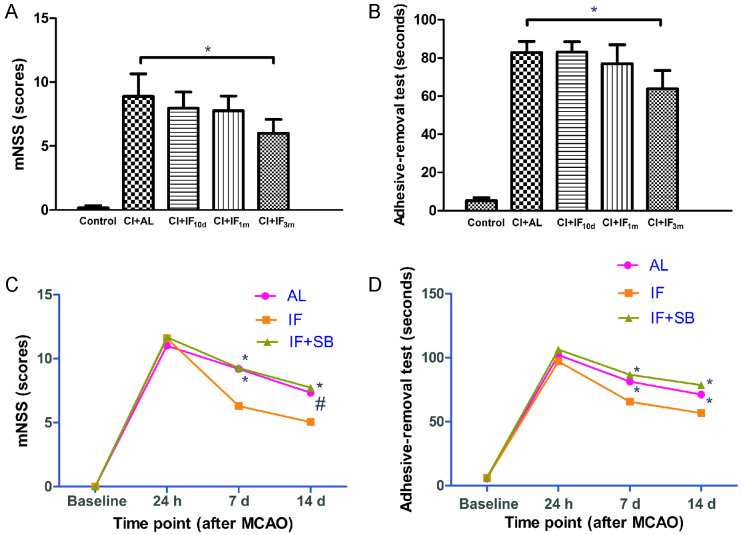
Fig 1. Neurological function assessment results in each group.
mNSS (A) and adhesive removal test (B) results in different dietary regimens of the 5 animal groups from the first step of this study 7 d after CI (n = 8/group). * p < 0.01, compared with the CI+AL group. mNSS (C) and adhesive removal test (D) results in different time points of 3 groups from the second step of this study (n = 16/group). # p < 0.05, * p < 0.01, compared with the IF group at the same time point.

