
Figure 3.
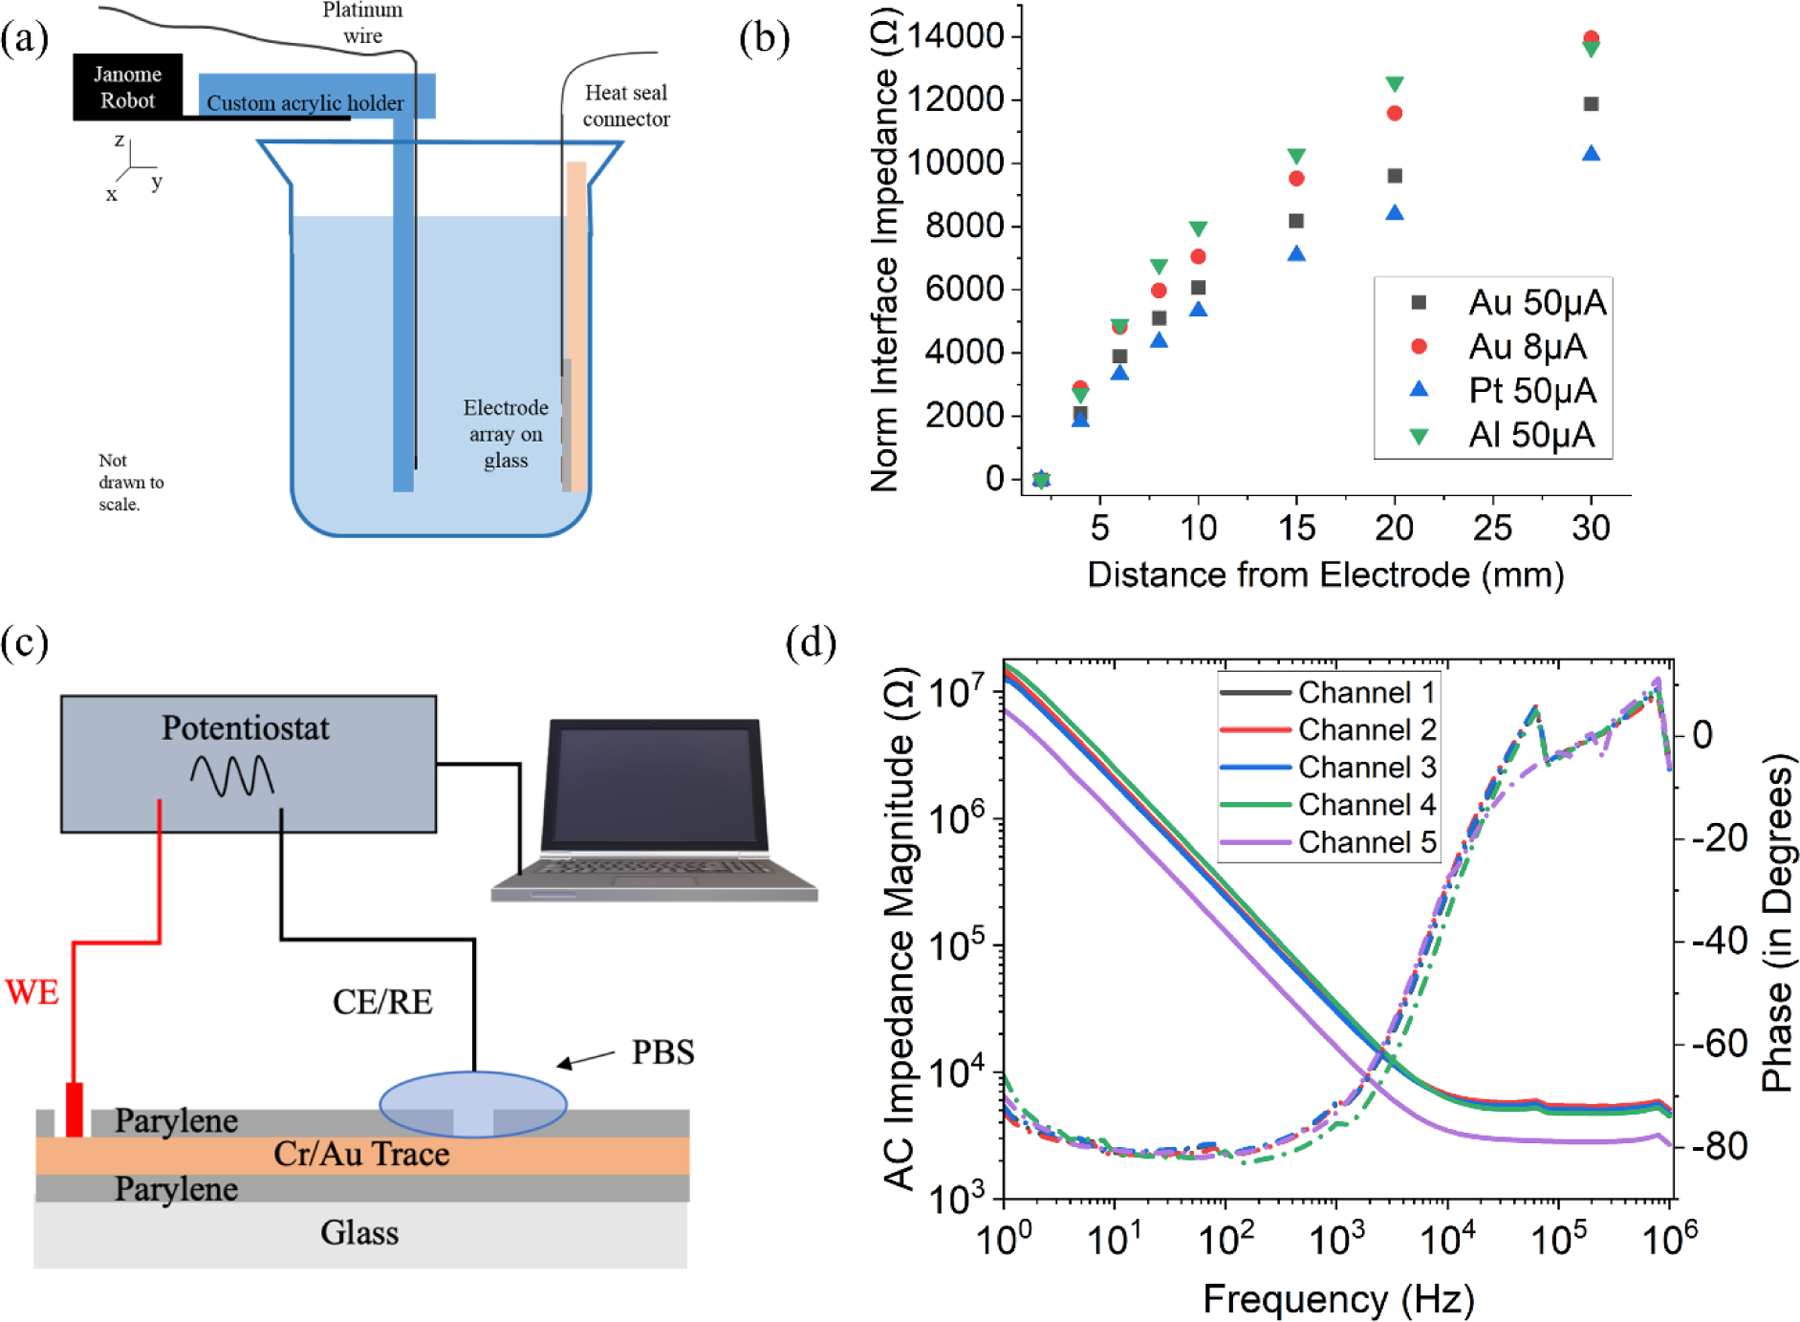
(a) Current drop-off measurement setup (b) Plot showing increase in the impedance of metal-water interface with increased distance from various metal electrodes (c) Electrochemical Impedance Spectroscopy (EIS) measurement setup (d) EIS impedance and phase plot as a function of frequency.