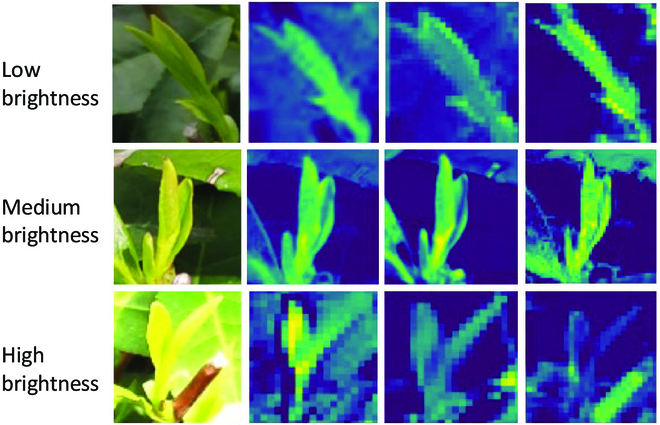
Fig. 10.

Feature maps of the tea images under different light intensities. Top, middle, and bottom rows: low-, medium-, and high-brightness images, respectively. First to last columns: original images, feature maps of the C3_2 module, feature maps of the C3_4 module, and feature maps of the C3_6 module in the SE-YOLOv5m model, respectively.
