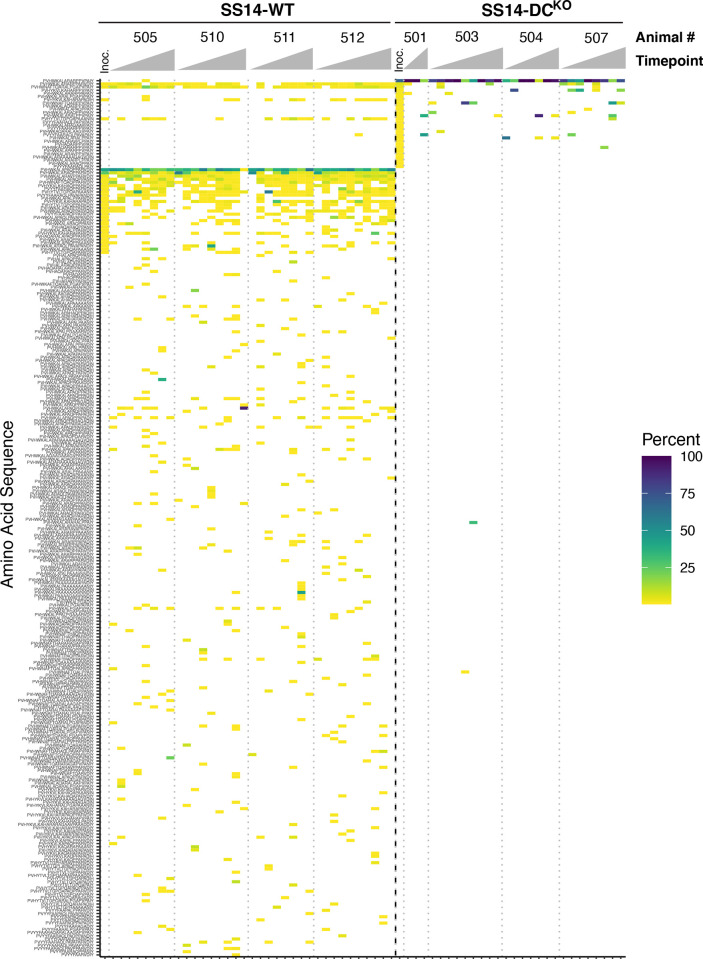
Fig 6. Heatmap of sequence diversity in TprK V6.
Amino acid sequences of TprK V6 derived from SS14-WT (left) or SS14-DCKO (right), separated by a bold dotted line. Each column represents the sequences present in a single biopsy for a single animal at a particular timepoint, with biopsy timepoints arranged left to right and animals separated by light dotted lines. Color scale represents the prevalence of each amino acid sequence within each sample. Inoculum samples are labeled “Inoc”. Sequences are arranged in order of decreasing prevalence in SS14-DCKO inoculum, then by SS14-WT inoculum. Missing samples did not yield data. Interactive heatmaps are available at https://github.com/greninger-lab/Impaired-TprK-Antigenic-Variation. Peptide sequences and prevalence are also reported in S2 Table.

