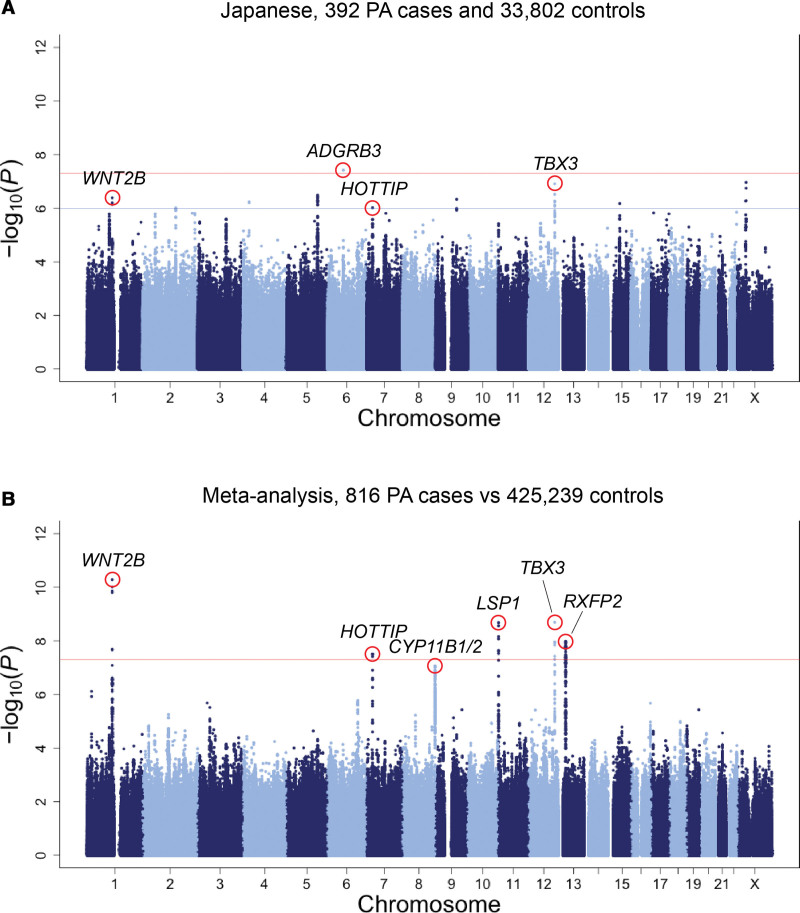
Figure 1.
Manhattan plot for the genome-wide association analysis of primary aldosteronism. Manhattan plots showing −log10(P value) of the genome-wide association study of primary aldosteronism (PA) in the Japanese cohort (A) and meta-analysis (B). The red horizontal line indicates the genome-wide significance threshold (P=5.0×10⁻⁸). We also display a suggestive significance threshold (P=1.0×10⁻⁶) as the blue horizontal line in the Japanese genome-wide association study.

