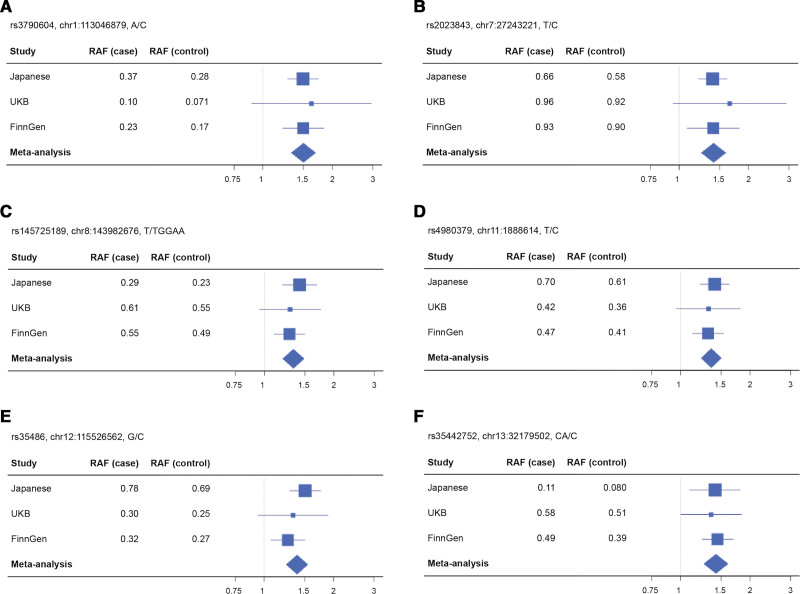
Figure 2.
Forest plots showing the odds ratios of lead variants for genome-wide and nearly genome-wide association loci for PA risk in each cohort. Forest plots for the odds ratios (ORs) of rs3790604 (A), rs2023843 (B), rs145725189 (C), rs4980379 (D), rs35486 (E), and rs35442752 (F) on the risk of primary aldosteronism (PA). Each forest plot shows the estimated ORs and 95% CIs from the cohort-specific genome-wide association study results. The variant name, chromosome position, and risk alleles and nonrisk alleles are shown above each plot. The size of the square representing the OR is proportional to the effective sample size of each cohort. RAF indicates risk allele frequency; and UKB, UK Biobank.

