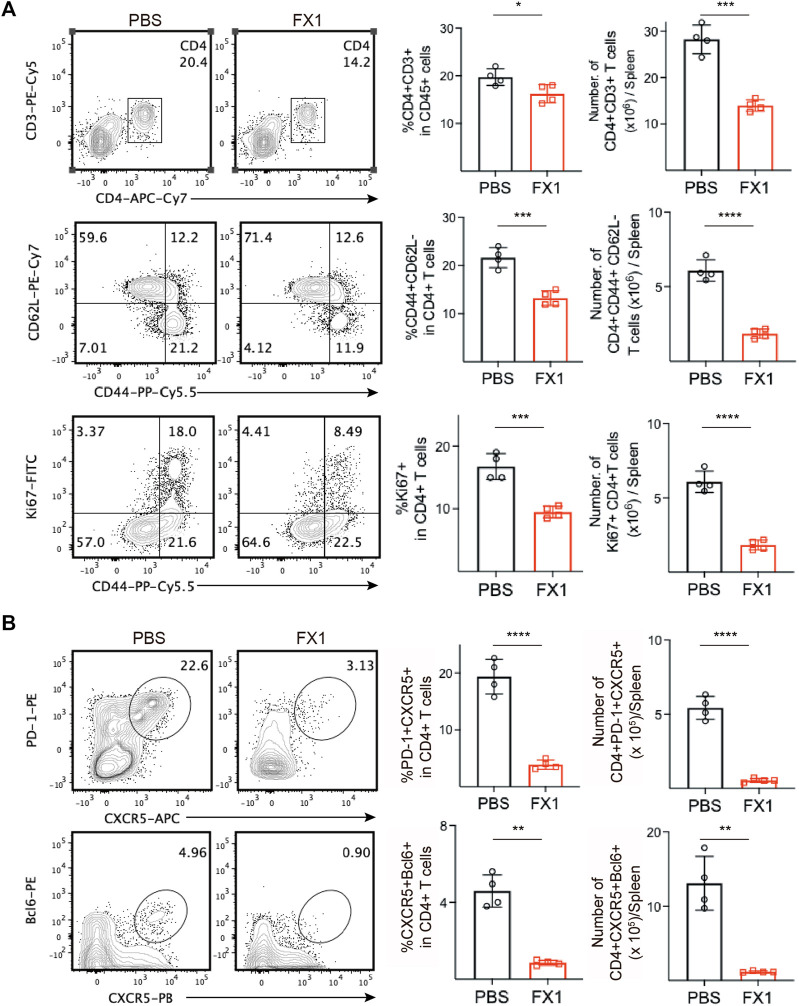
FIGURE 5.
FX1 inhibits T follicular helper cell expansion during chronic cardiac transplant rejection in mice (A). The spleens were obtained from the recipient mice on postoperative day 28 and were ground into single-cell suspensions for FCM detection. The contour plots demonstrate the ratios of characteristic CD3+CD4+ T cells, CD44+CD62L-T cells, and CD44+Ki67 + T cells in both groups, while the bar charts (n = 4) illustrate the ratios between the two groups (B). The contour plots demonstrate the ratios of characteristic PD1+CXCR5+ Tfh and BCL6+CXCR5+ Tfh in both groups, while the bar charts (n = 4) illustrate the ratios of Tfh cells between the two groups. Error bars represent SD. ns, not significant, *p < 0.05, **p < 0.01, ***p < 0.001, ****p < 0.0001.

