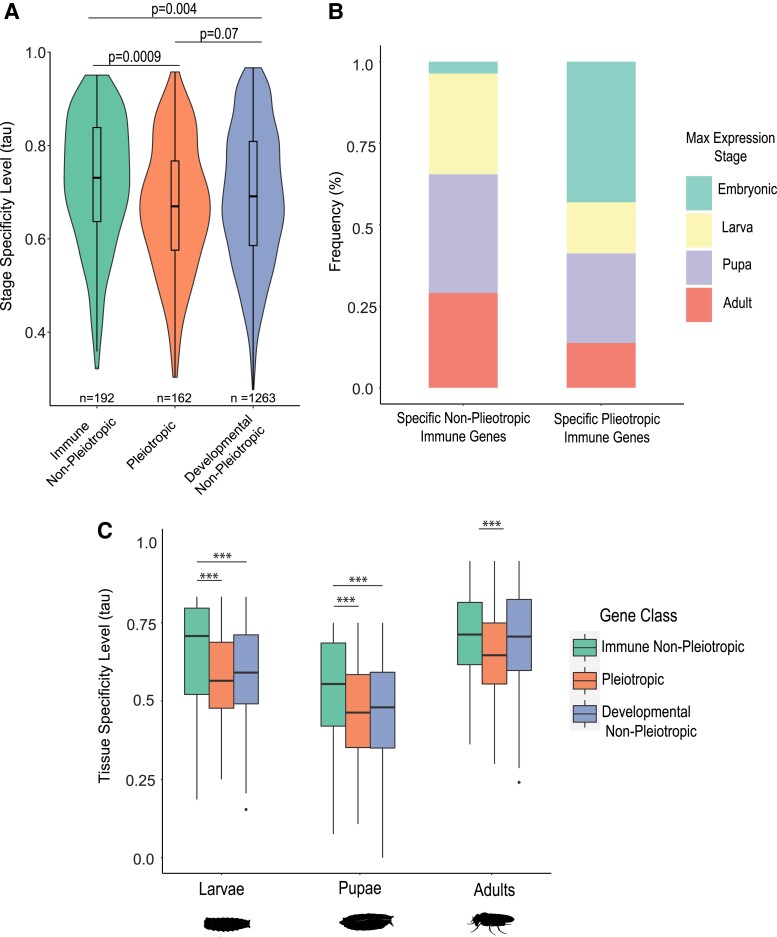
Fig. 2.
Comparison of relative life stage and tissue specificity of gene expression among immune, developmental, and pleiotropic genes. The stage specificity tau value, which varies from 0 (broadly expressed across all stages) to 1 (expressed in only one stage), was calculated for genes within each class (A). For the non-pleiotropic and pleiotropic immune gene group (B), the genes within the top 25th percentile of τ value were characterized as “specific genes,” and the stage with the highest expression for each gene was determined and tallied for the whole group. To compare tissue gene expression specificity between pleiotropic and non-pleiotropic genes within each life stage (C), the tau value (tissue specificity level) was calculated for each gene across tissues. Differences among groups were statistically analyzed using Kruskal–Wallis tests for overall significance followed by post hoc pairwise Dunn tests (Benjamini–Hochberg–adjusted P values on figure; *** indicates P.adj < 0.001).

