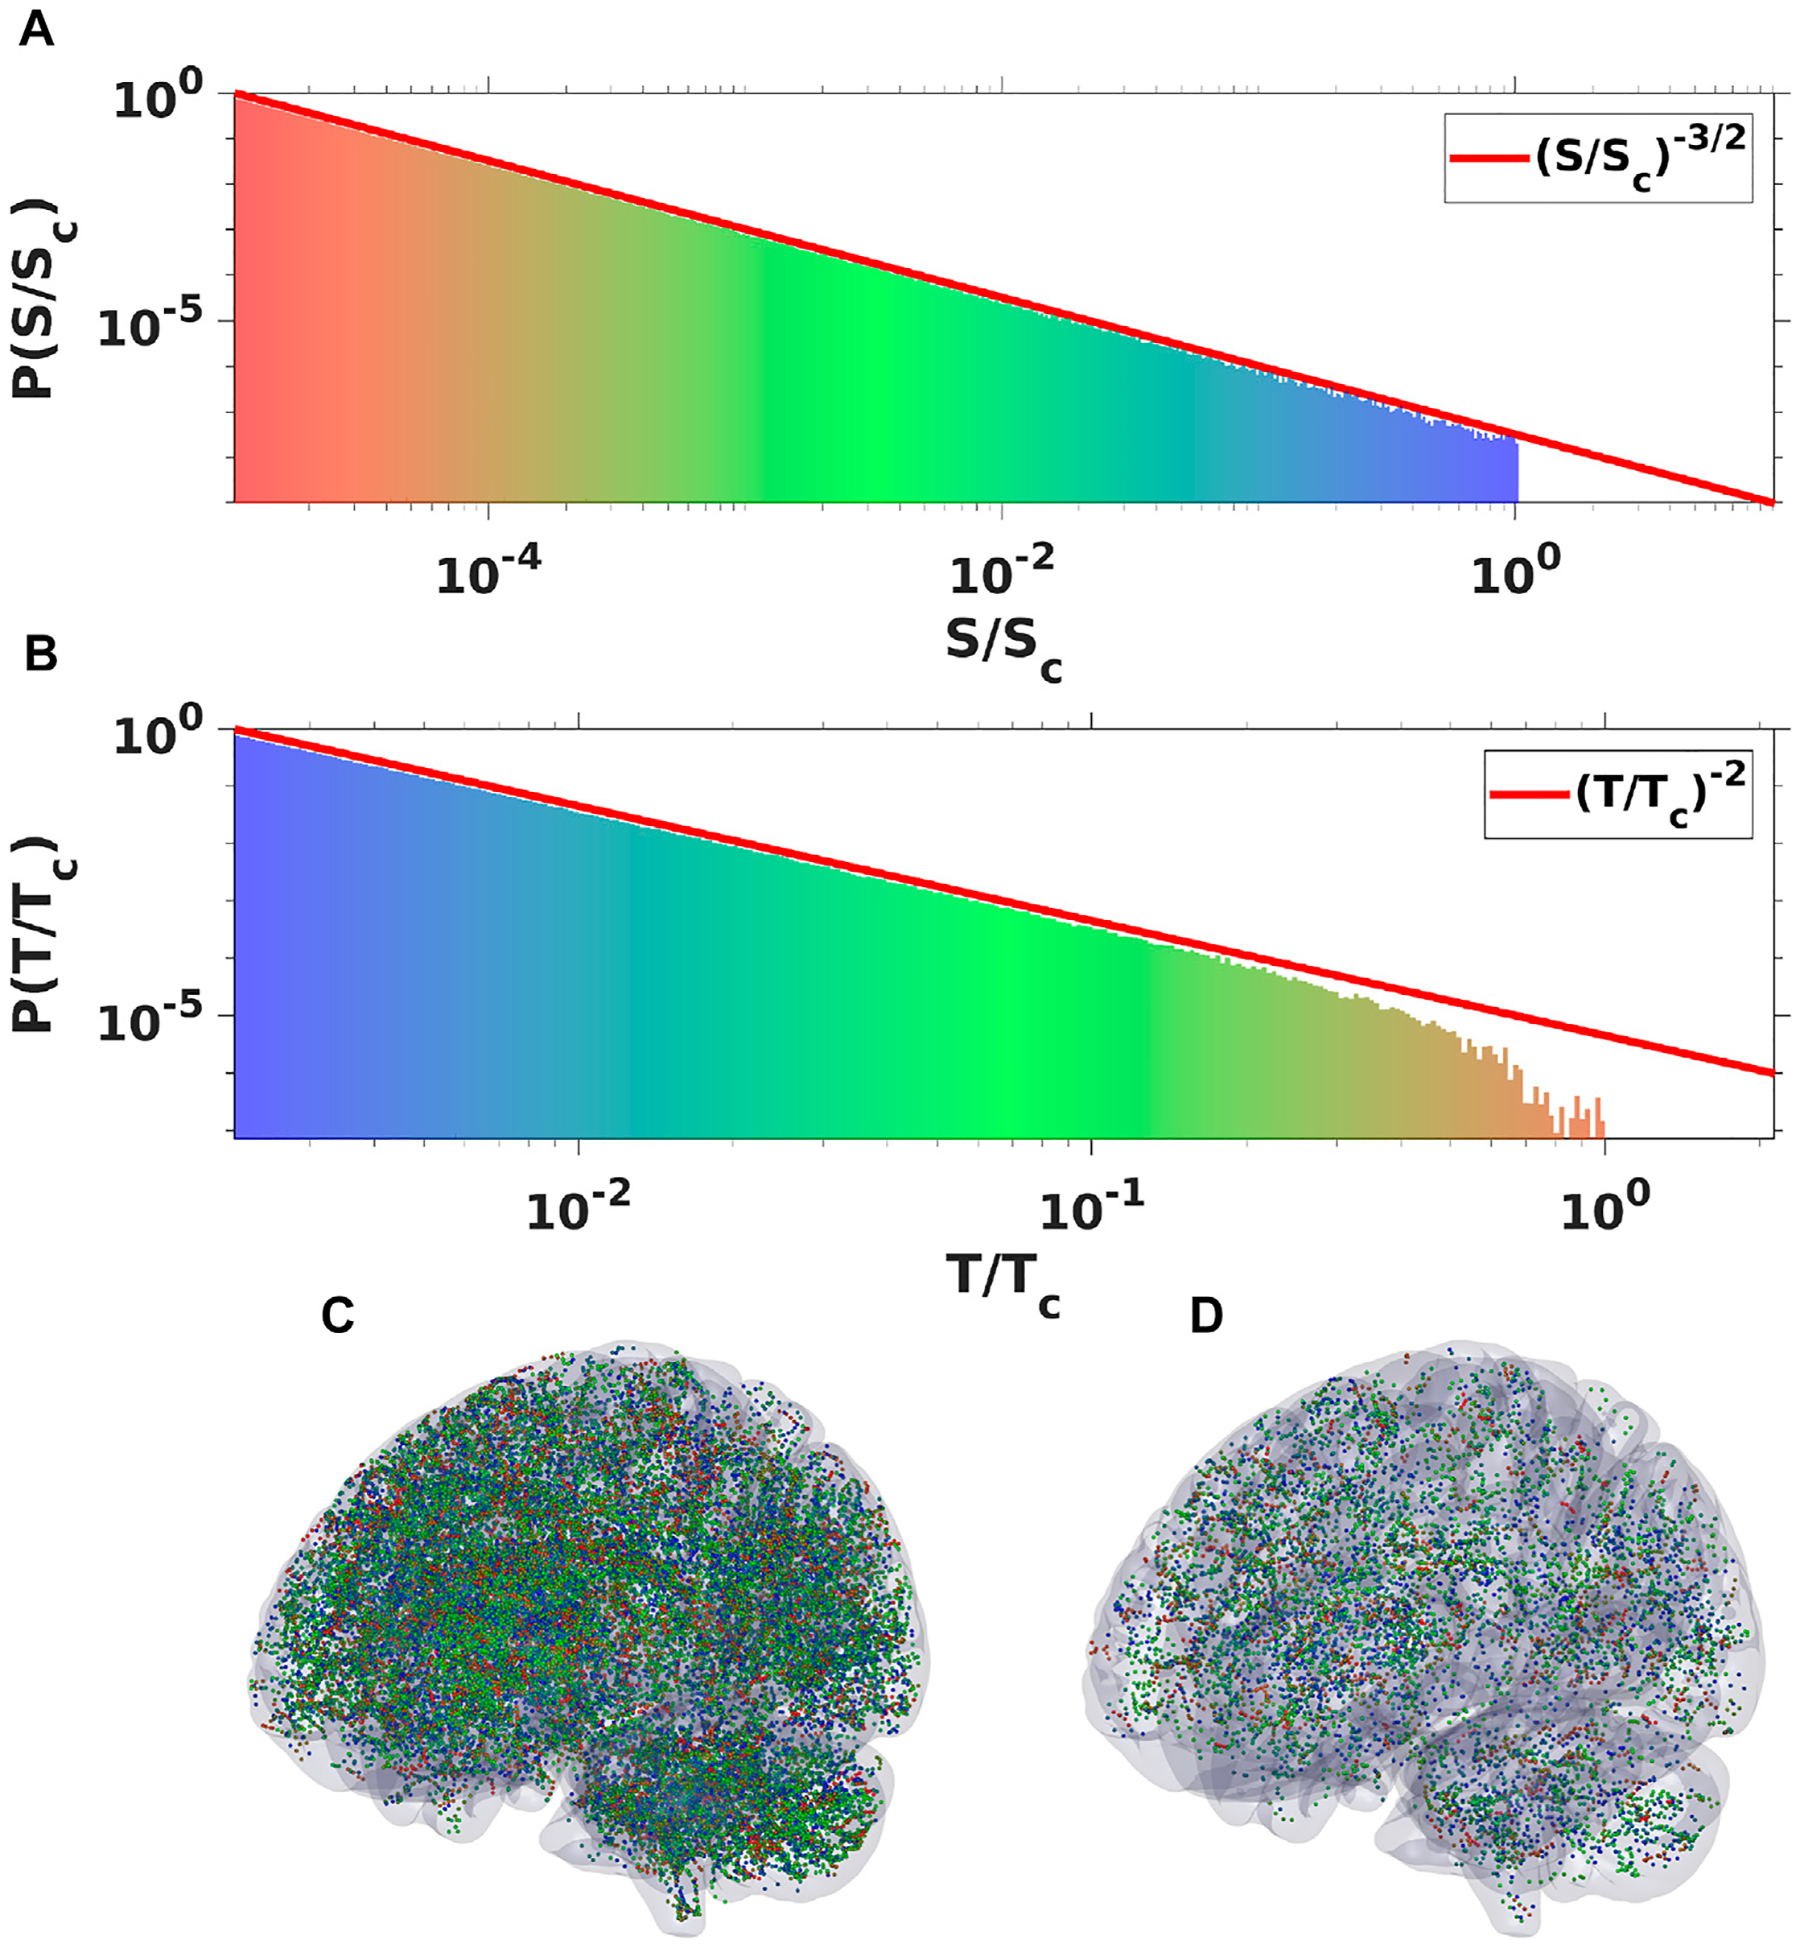
FIGURE 6.

Plots of spatial (A) and temporal (B) probability density spectra obtained by binning oscillatory signal of ensemble of 106 WETCOW modes randomly distributed and propagated through cortical tissue. Two examples of temporal signal (dots or “spikes”) snapshots with different values of signal threshold are shown in (C) and (D) (color pallet encodes the change of frequencies from the smallest (blue) to the largest (red).
