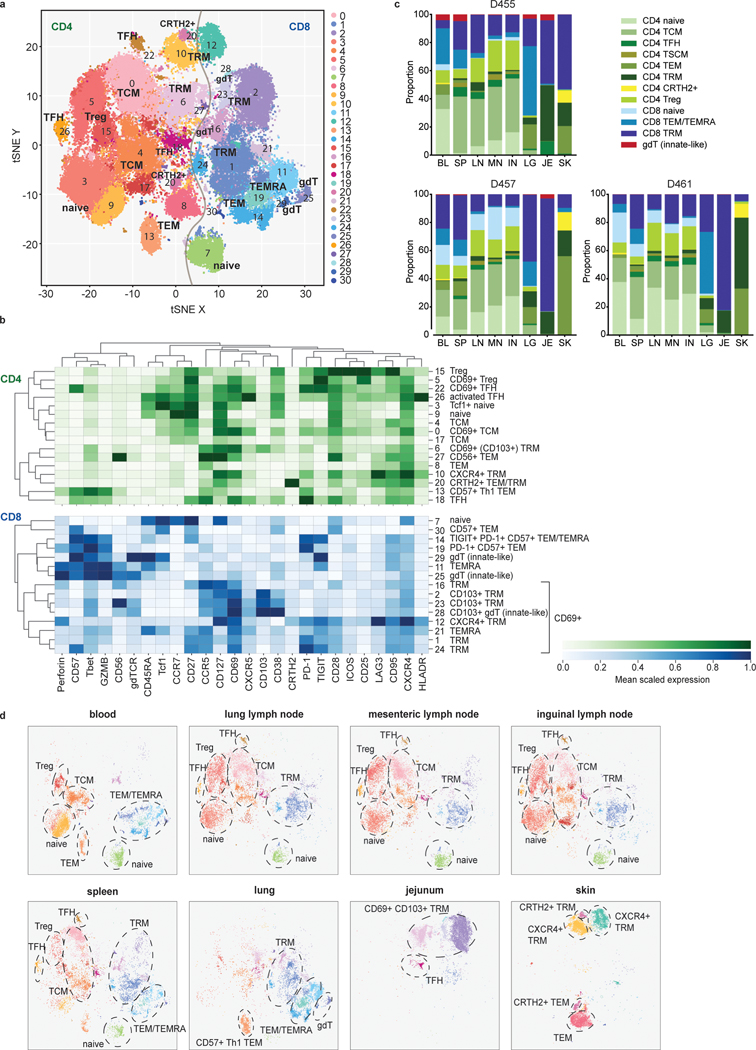
Figure 1: Site-specific T cell subset distribution in human barrier and lymphoid tissues.
T cells were isolated from blood, spleen, lung lymph node (LN), inguinal lymph node (IN), mesenteric lymph node (MN), lung, skin, and jejunum from three donors, stained with a 37-marker panel (Supplementary Table 2) and analyzed by cytometry by time-of-flight (CyTOF). a, The full complement of CD4+ and CD8+ T cell subsets from blood and 7 tissue sites of three donors, as defined by marker expression (see Extended Data Fig. 1), represented in a t-distributed stochastic neighbor embedding (t-SNE) plot. Cluster numbers correspond to T cell subsets defined in (b). b, Marker expression by CD4+ (top, green) and CD8+ (bottom, blue) T cell clusters in (a) defined by unsupervised clustering. The color intensity of each cell denotes the column-normalized mean scaled expression of each indicated marker within each cluster. c, Stacked bar chart of the proportion of T cell subsets in each site for each of the three donors. d, Composition of T cell subsets stratified by site compiled from three donors, represented as t-SNE plots. Prominent T cell subsets are highlighted by a dashed ellipse for each site. TFH, follicular helper T cell; TRM, tissue-resident memory T cell; gdT, gamma-delta T cell; Treg, regulatory T cell; TCM, central memory T cell; TEMRA, terminally-differentiated effector memory T cell; TEM, effector memory T cell; Th1, type-1 helper T cell; BL, blood; IN, inguinal lymph node; JE, jejunum; LG, lung; LN, lung lymph node; MN, mesenteric lymph node; SK, skin; SP, spleen.

