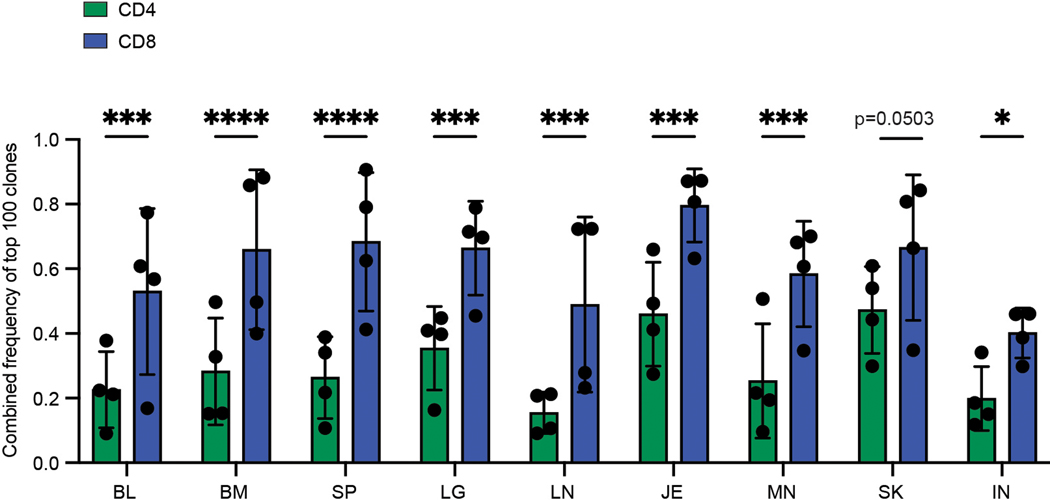
Extended Data Fig. 4. Clonal expansion of CD4+ and CD8+ T cells across sites.
Combined frequency of top 100 clones among CD4+ and CD8+ T cells from nine tissue sites. The height of each bar represents mean frequencies averaged across four donors. Statistical significance was calculated using two-way ANOVA matching tissue and CD4+/CD8+ subset and comparing each subset with the other subset in that tissue, followed by Tukey’s multiple comparisons test and indicated by ****, p ≤ 0.0001; ***, p ≤ 0.001; *, p ≤ 0.05. Error bars represent standard deviation. (n=4 independent human donors from each site). For raw data and individual p-values, see source data.

