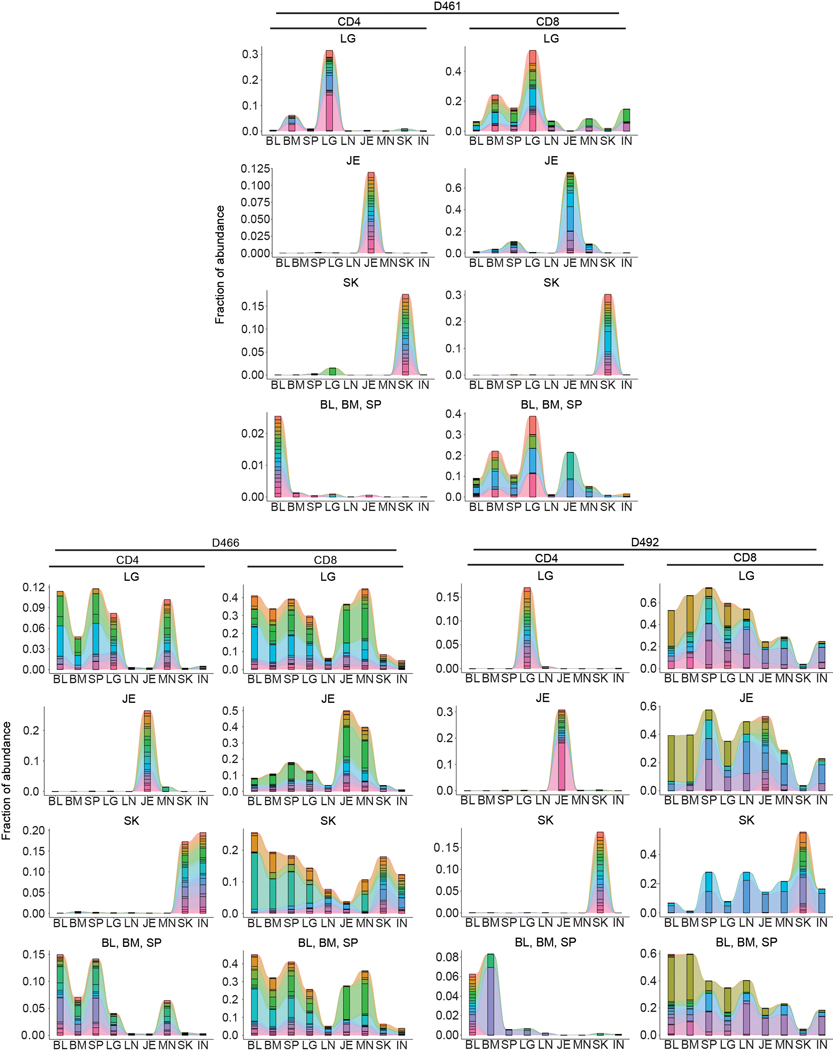
Extended Data Fig. 5. Clone tracking plots for individual donors.
Clone tracking plots illustrating overlap of top 20 clones within tissues or tissue grouping across nine tissue sites from donors D461 (top), D466 (bottom left), and D492 (bottom right), as presented in Figure 2. Height of each bar indicates fraction of the top 20 clones within each tissue site. Each color represents a unique clone tracked across all tissue sites.

