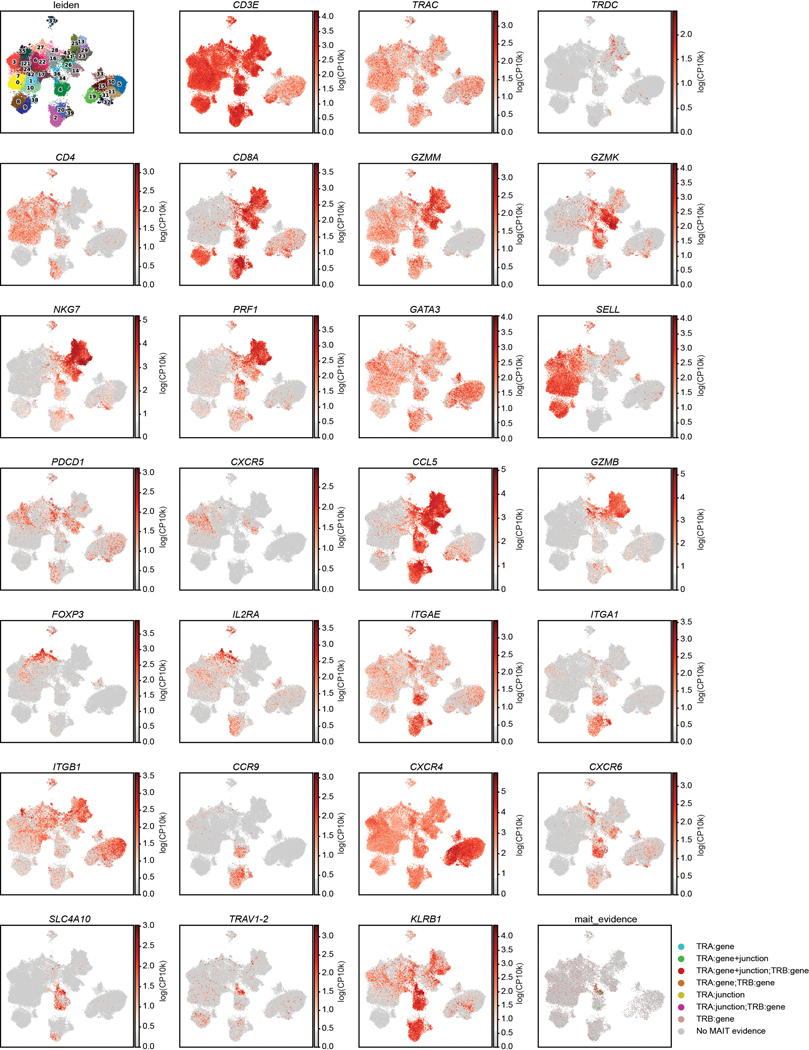
Extended Data Fig. 6. Scaled gene expression by T cells as measured by scRNA-seq.
UMAP embeddings as in Fig. 3 colored by Leiden clusters (top left), expression of selected gene markers as indicated which were used in annotation of clusters (Rows 1–7), and by MAIT evidence (bottom right plot). Color intensity on the gene expression plots is based on scaled log (normalized count per ten thousand (CP10k)+1) for each marker. MAIT evidence indicates whether scTCR-Seq revealed TRA gene usage, TRB gene usage, CDR3 sequence (junction) aligned to a database of known MAIT clones, a combination of these factors, or none (No MAIT evidence) (see Methods). Events lacking paired scTCR data are not plotted.

