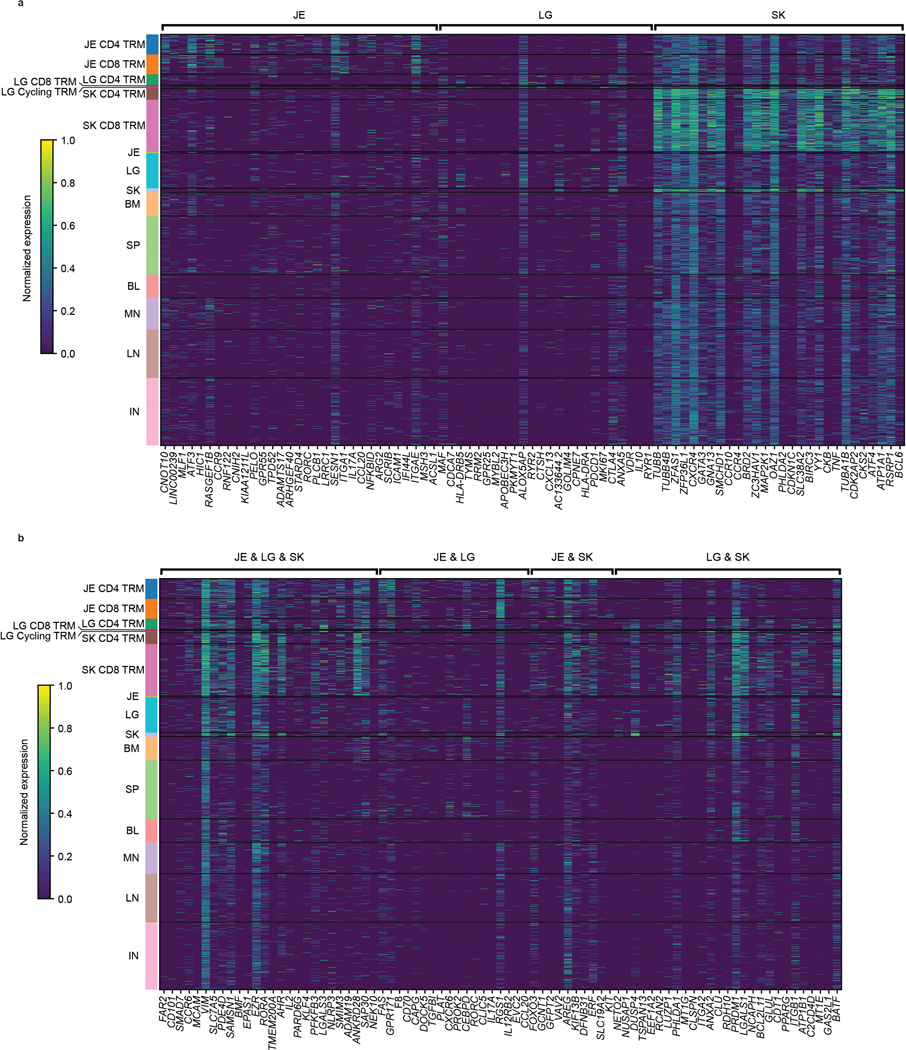
Extended Data Fig. 7. Expression of top shared and unique genes in barrier site-specific signatures.
(a, b) Heatmaps depicting top 10–25 and selected differentially expressed protein coding genes (p-value < 0.05, log-fold change > 2) in barrier TRM cells versus nonresident T cells across all tissues of both donors. Statistical significance was calculated using a two-sided Wilcoxon with tie correction, followed by a Benjamini-Hochberg adjustment for multiple comparisons. Genes are grouped by their differential expression being unique to (a) or shared between (b) barrier sites. Intensity represents column-normalized log (normalized count per ten thousand (CP10k)+1). Cells are grouped by their tissue site of origin and cell type: CD4 TRM, CD8 TRM, Cycling TRM, or other (including both all cells from non-barrier sites and non-TRM from barrier sites). TRM, tissue-resident memory T cell; BL, blood; BM, bone marrow; IN, inguinal lymph node; JE, jejunum; LG, lung; LN, lung lymph node; MN, mesenteric lymph node; SK, skin; SP, spleen.

