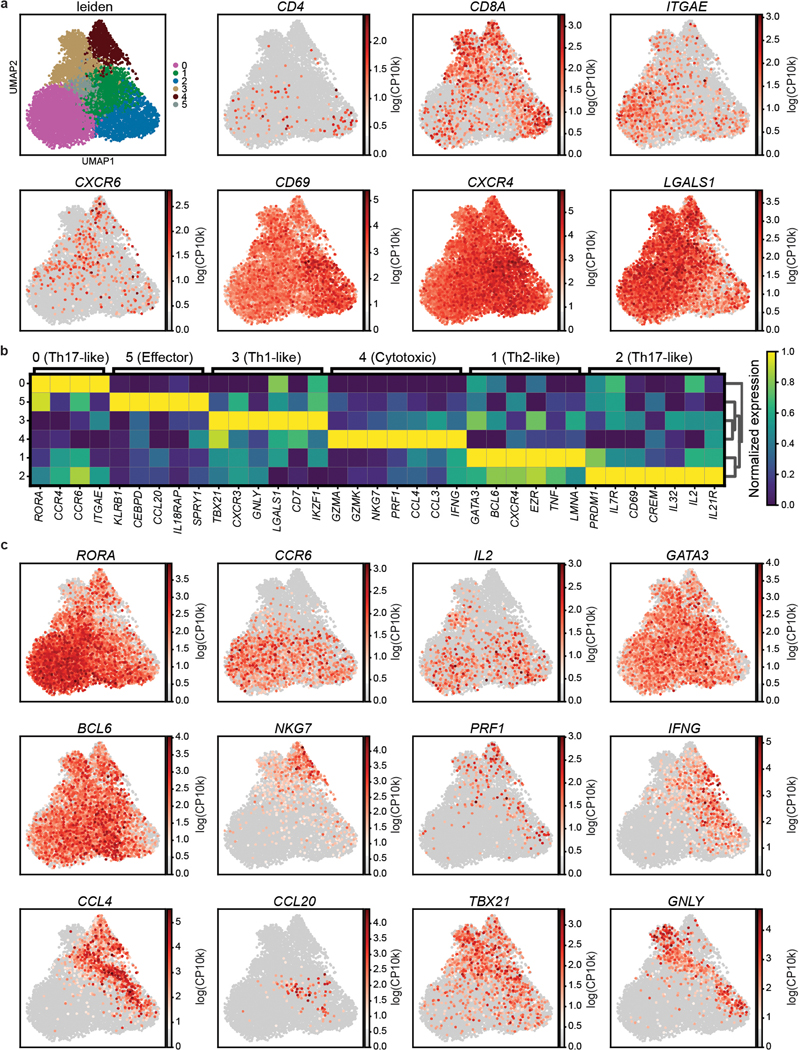
Extended Data Fig. 8. Transcriptional heterogeneity of skin TRM.

(a) UMAP embedding of skin TRM colored by Leiden cluster (top left), or gene expression. Color intensity of individual cells is based on scaled log (normalized count per ten thousand (CP10k)+1) of the indicated markers. (b) Heatmap depicting average expression of genes associated with T cell function upregulated (p-value < 0.05, log-fold change > 0.3) in each Leiden cluster. Intensity represents the mean column-normalized expression for the indicated gene. Statistical significance was calculated using a two-sided Wilcoxon with tie correction, followed by a Benjamini-Hochberg adjustment for multiple comparisons. (c) UMAP embeddings of skin TRM colored by expression of differentially expressed genes, as in (a).
