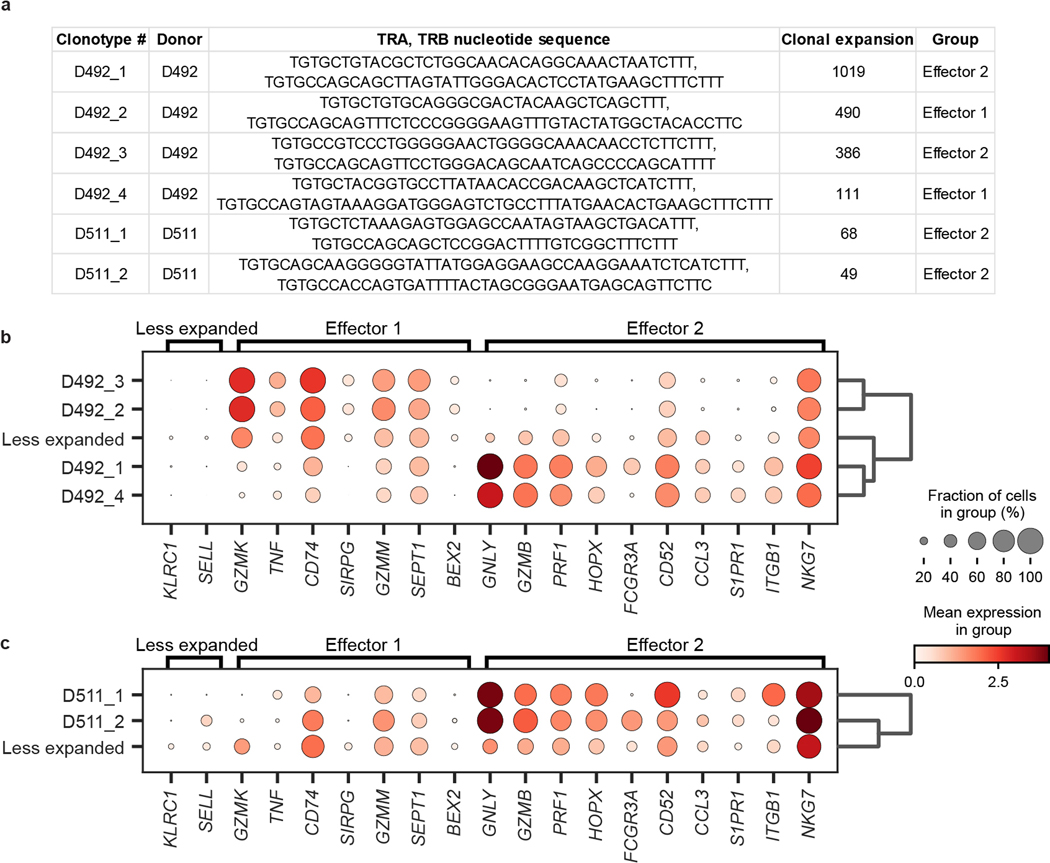
Extended Data Fig. 9. Effector function of expanded vs. unexpanded TEM/TEMRA clones.
(a) Table of expanded TEM/TEMRA clonotypes (>45 clonal cells) with their donor of origin, CDR3 nucleotide sequence for TRA and TRB, clonal expansion, and grouped effector function. (b, c) Dot plots depicting the differential expression of key markers by less expanded vs. expanded TEM/TEMRA cells from D492 (b) and D511 (c), grouped by effector function signatures “Effector 1” and “Effector 2”. The fraction of cells comprising expanded unique clones and collective less expanded clones that expressed any amount of the marker is displayed as dot size, and increased color intensity of the dots indicates higher mean expression level across cells from these groups. For each donor, expanded (>45 clones) TEM/TEMRA populations of the same clone are labeled uniquely, while less expanded (< 5 clones) TEM/TEMRA clones are grouped together.

