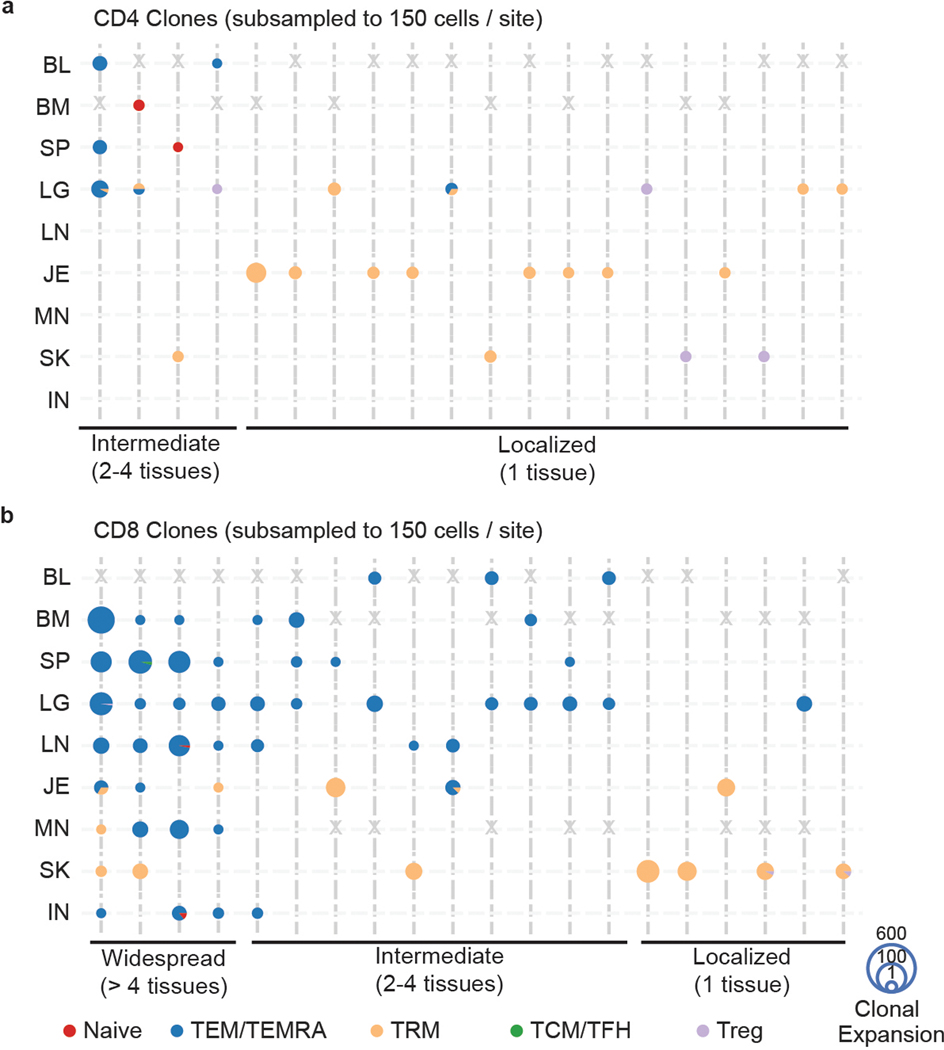
Extended Data Fig. 10. Clonal connections across tissues and subsets determined by normalizing cell numbers across sites.
To control for cell number differences across tissues for each donor, we picked a random selection of 150 CD4+ and CD8+ T cells for each sample and mapped the clonal connections across tissues and subsets as in Fig. 6 on the top 20 clones. a, b, Tissue distribution, T cell subset, and clonal expansion of CD4+ (a) and CD8+ (b) clones. CD4+ and CD8+ clones were defined by expression of CD4 or CD8A within cells sharing the same clone. Individual clones are represented across vertical lines, and pie charts are used to show the subset makeup of T cells that share that clonotype within each tissue. Size of each pie chart depicts the clonal expansion of each clone within that tissue site. The clones are grouped by their tissue distribution patterns (widespread, intermediate, or localized). Gray X’s mark the spaces where tissues were not sampled for one donor, or samples below the subset threshold (CD8+ MN in one donor only). TEM, effector memory T cell; TEMRA, terminally-differentiated effector memory T cell; TRM, tissue-resident memory T cell; TCM, central memory T cell; TFH, follicular helper T cell; Treg, regulatory T cell; BL, blood; BM, bone marrow; IN, inguinal lymph node; JE, jejunum; LG, lung; LN, lung lymph node; MN, mesenteric lymph node; SK, skin; SP, spleen.

