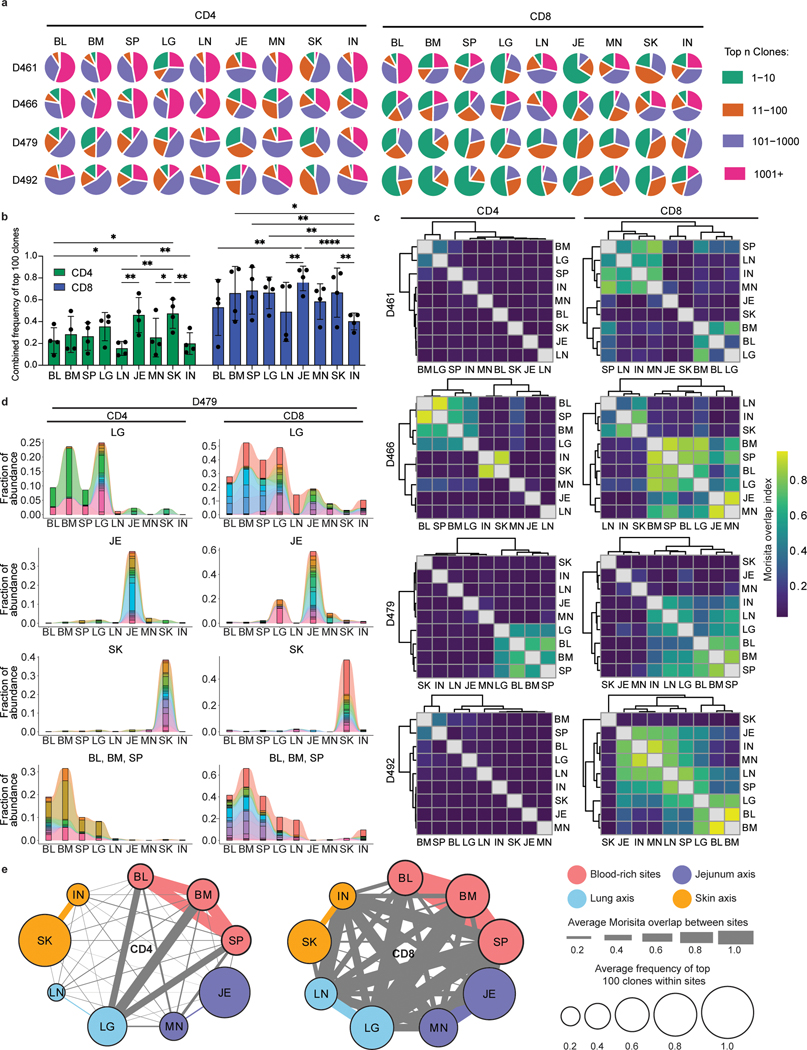
Figure 2: Distinct clonal connections define T cells in barrier sites.
CD4+ and CD8+ T cells were isolated from nine tissue sites four individual donors (D461, D466, D479, D492) for TCRB sequencing. a, Pie charts showing relative clonal abundance for CD4+ (left) and CD8+ (right) T cells from each sample showing the proportion of the repertoire occupied by the top 10, 100, 1000, or 1000+ clones. b, Combined frequency of top 100 clones among CD4+ (left, green) and CD8+ (right, blue) T cells. Bar height represents frequencies averaged across four donors. Statistical significance was calculated using two-way ANOVA matching tissue and CD4+/CD8+ subset and comparing tissues within each subset, followed by Tukey’s multiple comparisons test, and indicated by ****, p ≤ 0.0001; ***, p ≤ 0.001; **, p ≤ 0.01; *, p ≤ 0.05. Error bars represent standard deviation (n=4 independent human donors for each tissue-site). For raw data and individual p-values, see source data. c, Morisita overlap index between pairwise cell populations of CD4+ (left) or CD8+ (right) T cells. Color intensity is based on Morisita overlap index. d, Clone tracking plots illustrating overlap of top 20 clones across sites for representative donor D479. Bar height indicates the fraction of the repertoire occupied by the top 20 clones within each tissue site. Each color represents a unique clone. e, Network representation of CD4+ (left) and CD8+ (right) T cell clones in blood, lymphoid, and barrier sites across the body. The diameter of each circle is proportional to the average frequency of the top 100 clones in that tissue; line thickness is proportional to the Morisita overlap index between populations within the two connecting tissue sites; and specific networks of overlap for groups of tissues are indicated by color. BL, blood; BM, bone marrow; IN, inguinal lymph node; JE, jejunum; LG, lung; LN, lung lymph node; MN, mesenteric lymph node; SK, skin; SP, spleen.

