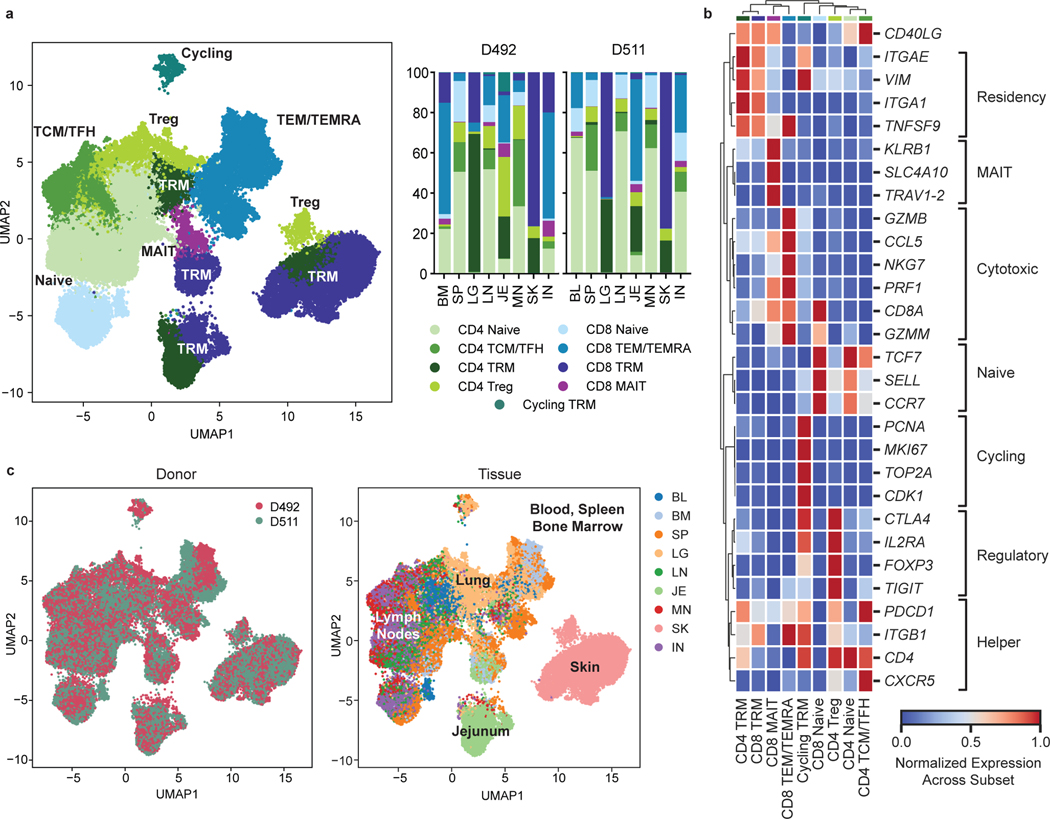
Figure 3: Single-cell transcriptome profiling reveals subset and tissue-specific signatures for T cells.
Total (CD3+) T cells were isolated from 9 sites of two donors for 5’single cell RNA sequencing (scRNA-seq, see Methods). a, UMAP embedding of scRNA-seq data based on highly variable genes and integrated across donor, colored by T cell subset (left). The proportion of T cell subsets in each tissue for each donor is depicted in a stacked bar chart (right). b, Clustered heatmap displaying normalized log-transformed expression of selected markers that were used to inform cluster and subset annotation. Marker genes are annotated by functional groups. c, UMAP embedding as in (a) colored by donor (left) or tissue (right) of origin. TCM, central memory T cell; TFH, follicular helper T cell; TRM, tissue-resident memory T cell; Treg, regulatory T cell; TEM, effector memory T cell; TEMRA, terminally-differentiated effector memory T cell; MAIT, mucosal-associated invariant T cell; BL, blood; IN, inguinal lymph node; JE, jejunum; LG, lung; LN, lung lymph node; MN, mesenteric lymph node; SK, skin; SP, spleen.

