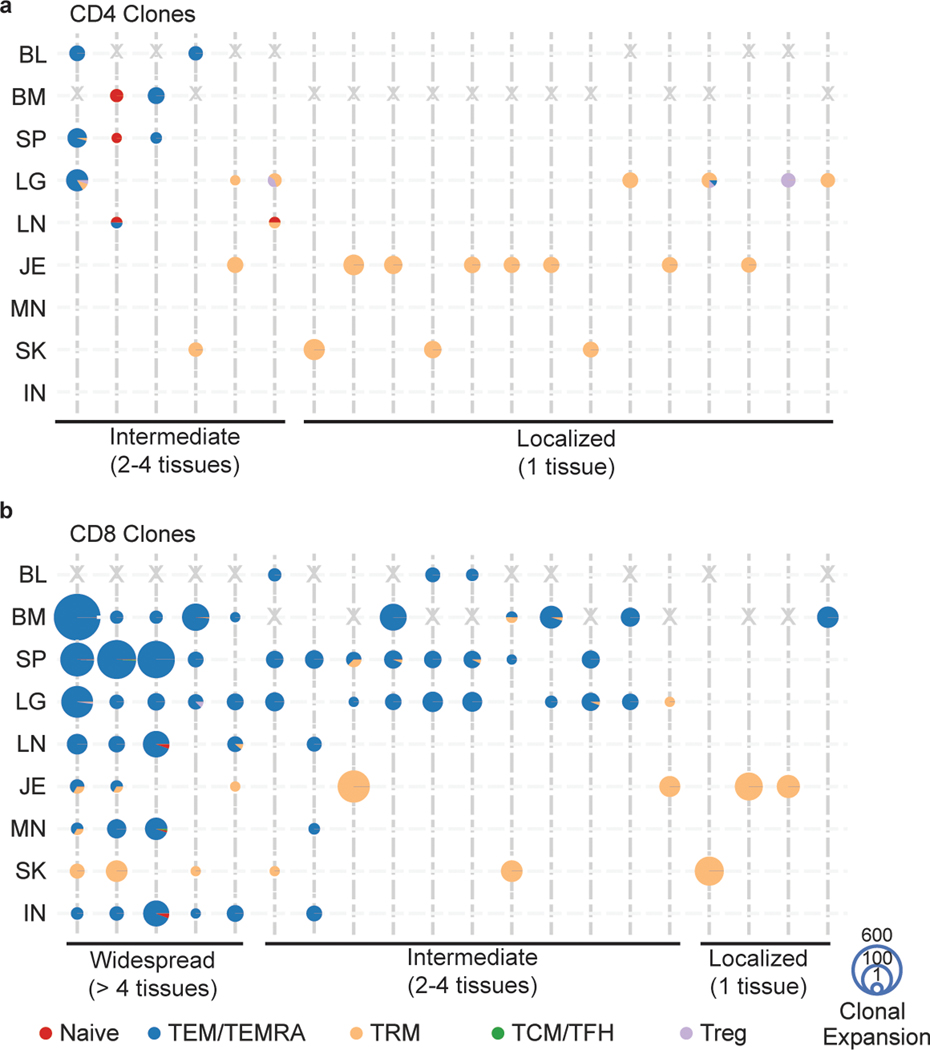
Figure 6: TEM/TEMRA clones are disseminated while TRM clones exhibit localized expansions.
a, b, Tissue distribution, T cell subset, and clonal expansion of CD4+ (a) and CD8+ (b) clones. CD4+ and CD8+ clones were defined by expression of CD4 or CD8A within cells sharing the same clone. Individual clones are represented across vertical lines, and pie charts are used to show the subset makeup of T cells that share that clonotype within each tissue. Size of each pie chart depicts the clonal expansion of each clone within that tissue site. The top 20 highly expanded CD4+ and CD8+ clones for both donors were selected, and grouped by their tissue distribution (widespread, intermediate, or localized). Gray X’s mark the spaces where tissues were not sampled for one donor. BL, blood; BM, bone marrow; IN, inguinal lymph node; JE, jejunum; LG, lung; LN, lung lymph node; MN, mesenteric lymph node; SK, skin; SP, spleen.

