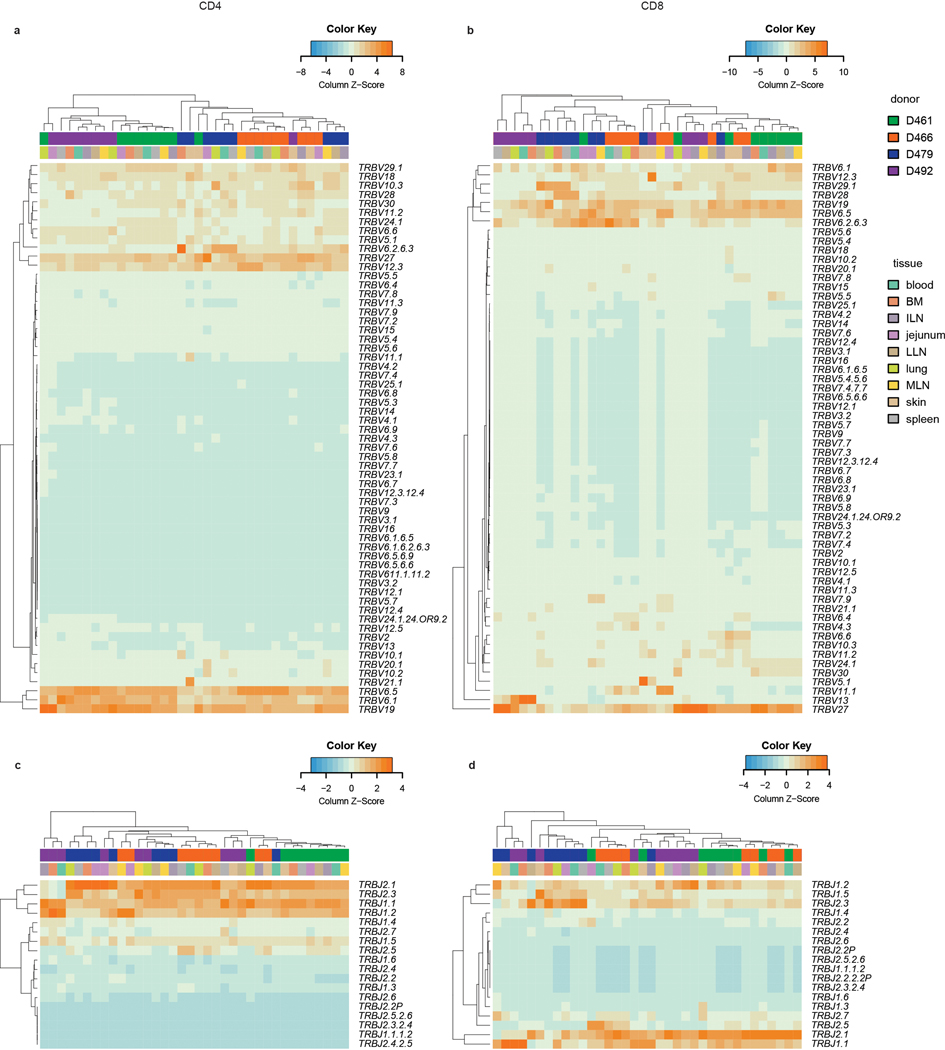
Extended Data Fig. 3. TRBV and TRBJ gene usage of CD4+ and CD8+ T cell clones across multiple tissue sites and donors.
Heat maps show TRBV usage by site and donor for CD4+ T cells (a) and CD8+ T cells (b) and TRBJ usage by site and donor for CD4+ T cells (c) and CD8+ T cells (d). Donor and tissue are indicated by color bars above each heatmap. Color intensity of each cell is based on column z-score and indicated by the color key accompanying each heatmap. Each unique clone is counted once per donor.

