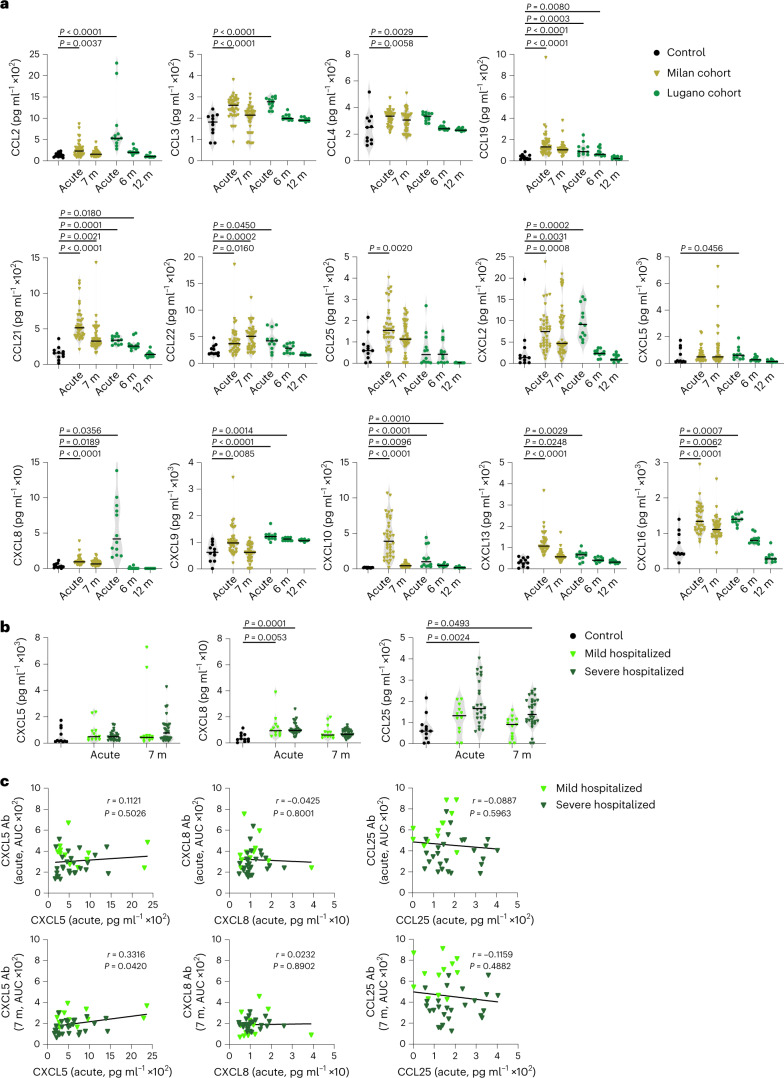
Fig. 3. Concentration of plasma chemokines during acute COVID-19 and in convalescence.
a, Plasma chemokine levels in the Milan (n = 44; acute and month 7) and Lugano (n = 12; acute, months 6 and 12) cohorts compared with healthy controls (Controls, n = 11). Horizontal bars indicate median values. Kruskal–Wallis test followed by Dunn’s multiple comparison test over healthy controls. b, Concentration of CXCL5, CXCL8 and CCL25 in healthy controls (n = 11) versus acute (n = 12, mild hospitalized; n = 26, severe hospitalized) and month 7 (n = 13, mild hospitalized; n = 31, severe hospitalized) COVID-19 convalescents in the Milan cohort. Horizontal bars indicate median values. Kruskal–Wallis test followed by Dunn’s multiple comparison test. c, Correlation between levels of chemokine (acute) and autoantibody (acute or month 7) by two-tailed Pearson correlation analysis in mild hospitalized (n = 12) and severe hospitalized (n = 26) COVID-19 convalescents in the Milan cohort.

