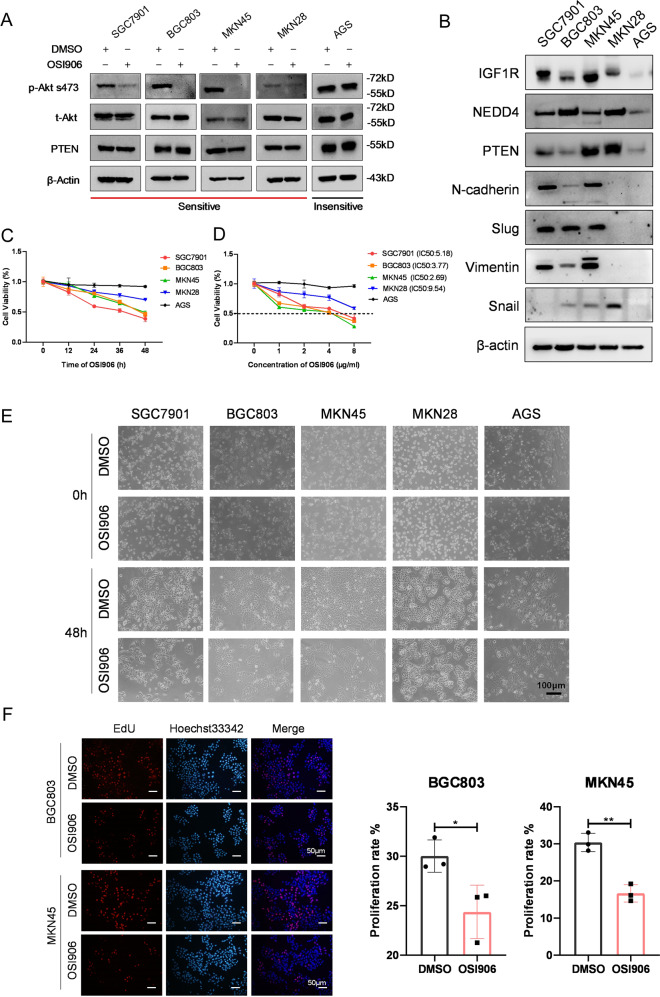
Fig. 1. GC cell lines show differential sensitivity to IGF1R specific inhibitor.
A Western blot analysis of p-Akt s473, t-Akt, PTEN, and β-actin protein levels in five GC cell lines after being treated with DMSO and OSI906 (2 μg/ml, 48 h). B Western blot analysis of the constitutive expression of IGF1R, NEDD4, PTEN, N-Cadherin, Slug, Vimentin, and Snail in five GC cell lines. Cell activity (%) detection after treatment of 2 μg/ml OSI906 for 0, 12, 24, 36, and 48 h, respectively (C) and treatment of 0, 1, 2, 4, and 8 μg/ml OSI906 for 48 h respectively (D) by Cell Counting Kit-8 (CCK-8) assay. The IC50 of SGC7901, BGC803, MKN45, and MKN28 is 5.18, 3.77, 2.69, and 9.54 μg/ml, respectively. E Representative Microscope images of five GC cell lines treated with DMSO (0 h and 48 h) and OSI906 (2 μg/ml, 0 and 48 h). F The EdU (5-Ethynyl-2′- deoxyuridine) assay showing the proliferation rate of BGC803 and MKN45 after being treated with OSI906 (2 μg/ml) for 48 h. ***p < 0.001, **p < 0.01, *p < 0.05.

