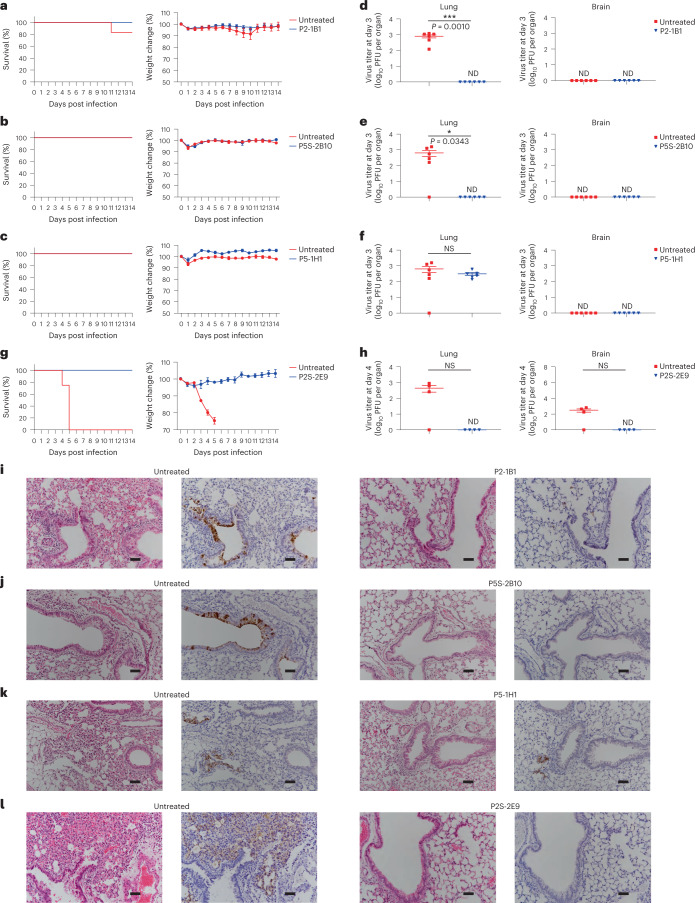
Fig. 4. P2-1B1, P5S-2B10, P5-1H1 and P2S-2E9 prophylaxis protects K18-hACE2 mice from infection with SARS-CoV-2 omicron BA.1 or beta.
a–c, Survival percentage and body weight recorded daily post infection with BA.1 until death occurred or at the end point of experiments at 14 dpi in P2-1B1 (a), P5S-2B10 (b) and P5-1H1 (c) groups. d–f, Lung viral titers and brain viral titers in mice killed at 3 dpi for BA.1 in P2-1B1 (d), P5S-2B10 (e) and P5-1H1 (f) groups. g, Survival percentage and body weight recorded daily post infection with beta until death occurred or at the end point of experiments at 14 dpi in P2S-2E9 group. h, Lung viral titers and brain viral titers in mice killed at 4 dpi for beta in P2S-2E9 group. Weight change and PFU per organ are presented as mean ± s.e.m. The significance was estimated by a two-tailed, unpaired t-test. *P < 0.05; ***P < 0.001; NS, not significant; ND, not detected. i–l, H&E and immunohistochemistry staining of lung tissue from P2-1B1 (i), P5S-2B10 (j), P5-1H1 (k) or P2S-2E9 (l) intraperitoneally treated and corresponding untreated mice at day 3 (BA.1) or day 4 (beta) post infection. Dark brown, cells positive for SARS-CoV-2 N protein. Scale bars, 50 µm. Images were derived from one representative mouse in each group. The P2-1B1 experiment shared the same negative control mice as previously published50. P5S-2B10 and P5-1H1 experiments shared the same negative control mice in this study. dpi, days post infection; H&E, hematoxylin and eosin.

