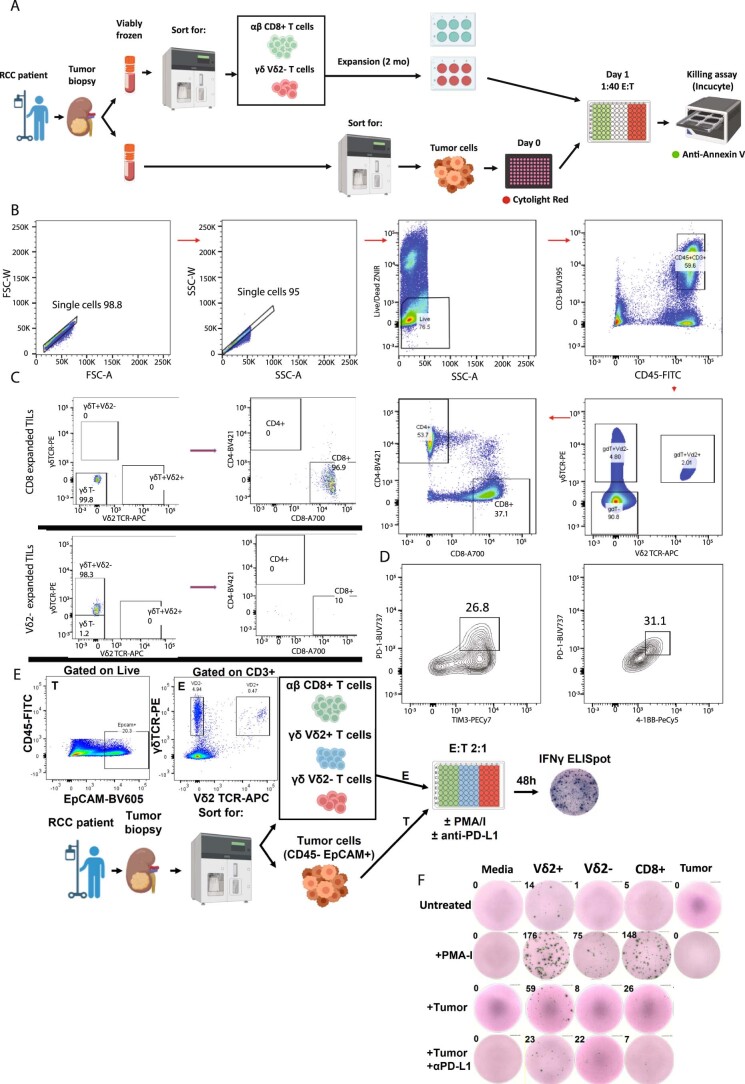
Extended Data Fig. 7. Autologous killing assay with sorted lymphocytes.
a. Diagram showing the workflow to obtain pure tumor cell, αβ or γδ T cell populations from RCC biopsies and conditions for the autologous killing assay co-cultures. b. Flow cytometry gating strategy used to sort TIL populations from digested RCC tumor biopsies. c. Flow cytometry dot plots showing the sorted αβ CD8+ or γδ TIL populations after downstream expansion before adding them to cytotoxicity assays in co-culture with target autologous tumor cells. d. Flow cytometry contour plots showing expression of PD-1, TIM3 and 4-1BB in expanded Vδ2- T cells used in autologous killing assays. e. Diagram showing the workflow for generating fresh autologous TIL:tumor cocultures for immune stimulation and readout by ELISpot. Pseudocolor flow cytometry plots show gating strategy for cell sorting of target populations. f. Human IFNγ ELISpot representative individual well images from TIL:tumor cocultures with QC-passed counts shown on the upper left edge of each well. Row titles stand for stimulation conditions. Column titles show sorted cell populations present in the wells. Created with BioRender.com.

