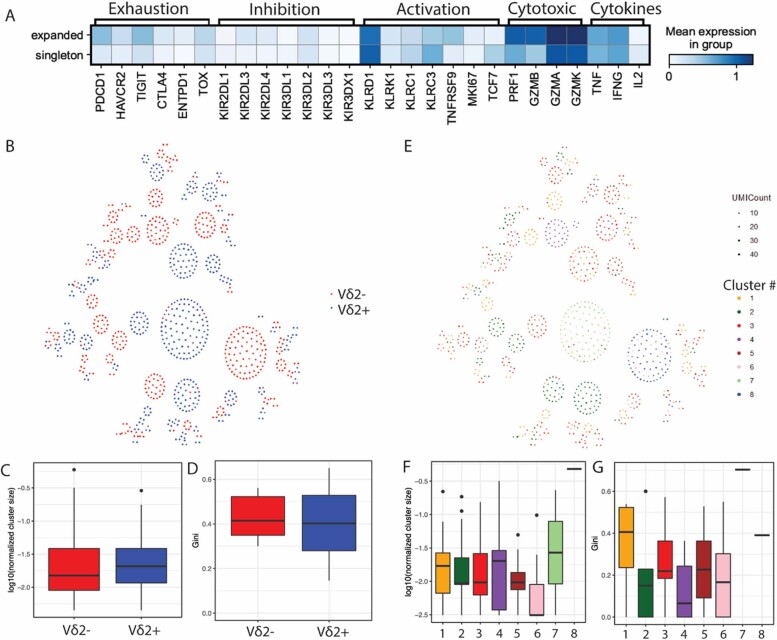
Extended Data Fig. 8. γδ TCR analyses of clonal expansion and diversity.
a. Heatmap showing the relative expression of select markers from T cell clonotypes that were either expanded (>1) or singleton cells shown in Fig. 5a (middle). b. Social network diagram showing all expanded γδ TCR clonotypes, colored by Vδ chain usage. Each dot represents an individual cell. Each node of dots clustered together represents cells with an identical TCR. c. Network analysis was done for each patient (n = 6) and cluster size represents total number of cells sharing a given clone by Vδ2- (red) or Vδ2+ (blue). The log-normalized cluster sizes are shown. d. The clonal diversity (gini index) was calculated based on the number of cells belong to a single TCR clone within for each patient by Vδ2- (red) or Vδ2+ (blue). e. Social network diagram showing all expanded γδ TCR clonotypes, colored by phenotypic cluster. Each dot represents an individual cell. Each node of dots clustered together represents cells with an identical TCR. Network analysis was done for each patient and cluster size represents total number of cells sharing a given clone by phenotypic clusters. g. The clonal diversity (Gini index) which was calculated based on the number of cells belong to a single TCR clone within for each patient by phenotypic clusters. In all boxplots, each box represents 0.25–0.75 percentile of the transformed cluster size or Gini score, with line extensions up to 1.5 times the interquartile range; horizontal line represents the median.

