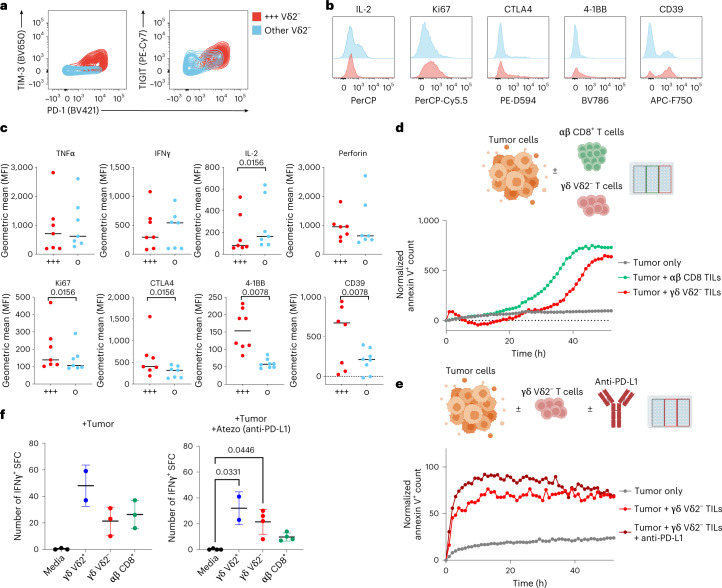
Fig. 3. A mixed functional phenotype does not compromise cytotoxicity and cytokine release.
a, Representative flow cytometry contour plots showing median values of surface expression of PD-1, TIGIT and TIM3 by tumor-infiltrating Vδ2− γδ+ T cells in n = 8 tumor samples. Cells co-expressing PD-1, TIGIT and TIM3 (PTT+) are highlighted in red, while the remaining Vδ2− cells are in blue. b, Flow cytometry histograms illustrating the differential expression of IL-2, Ki67, CTLA-4, 4-1BB, and CD39 on PTT+ Vδ2− (in red) compared with non-PTT+ Vδ2− cells (in blue). Cells were stimulated in vitro for 4 h with PMA+ ionomycin. c, Intracellular expression levels of TNF, IFNγ, IL-2, perforin and CTLA-4, and surface expression for Ki67, 4-1BB and CD39 were measured by flow cytometry and depicted by geometric MFI. P values by Student’s t-test are shown beneath each marker name. d, Representative time-course tumor cell killing (n = 2 independent experiments with different donors) in cultures of primary RCC tumor cells cultured alone (gray) or with autologous sorted αβ CD8+ (green) or γδ Vδ2− TILs (red) (E:T 40:1). Quantification was performed by time-lapse microscopy. Target tumor cells were prestained with CytoLight Red, and tumor cell death was measured with annexin V+ staining of CytoLight Red+ cells. Values at time 0 from cultures with TILs alone were subtracted for normalization. e, Tumor cell killing in cultures with autologous Vδ2− TILs with or without anti-PD-L1 (showing one of two independent experiments). f, IFNγ+ ELISpot counts from ex vivo cultures (n = 2 independent experiments with n = 2 different donors) with γδ or αβ sorted TILs stimulated with autologous kidney tumor cells (E:T 2:1) in the presence or absence of anti-PD-L1. Error bars represent standard deviation. P values obtained by nonparametric one-way ANOVA adjusted for multiple comparisons. Elements in d and e were created with http://BioRender.com.

